PROTECTED SOURCE SCRIPT
已更新 BiasByCryptx
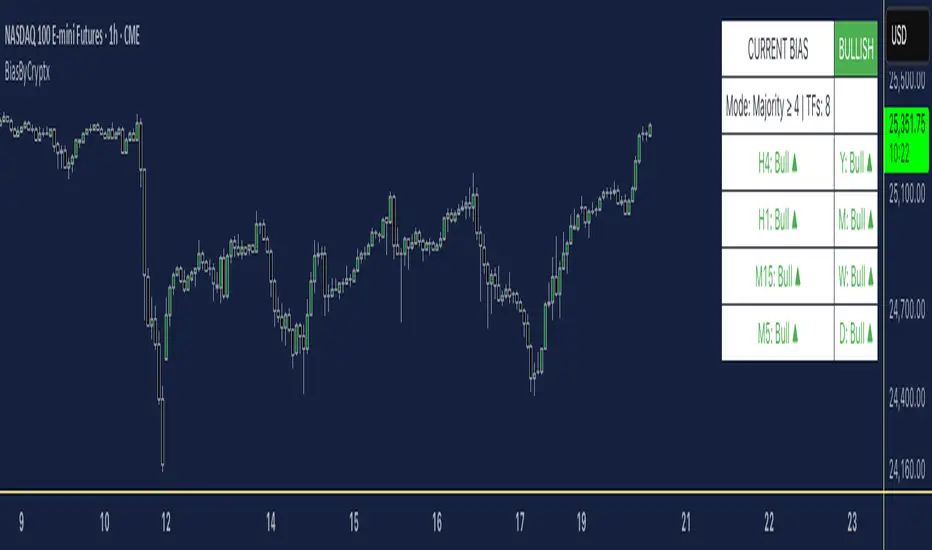
This is a lightweight market-bias dashboard. For each selected timeframe, Prior Year, Month, Week, Day, H4, H1. It uses the previous completed period’s high and low to compute the 50% midpoint, then labels Bullish when the current bar is above it, otherwise, Bearish.
You can choose which timeframes contribute and how agreement is determined: Strict (all selected must agree) or Majority (≥ N). The dashboard shows the overall bias and per-timeframe status with green ▲ (Bull) and red ▼ (Bear). It relies only on completed prior periods (no look-ahead) for stable signals and suits both intraday (e.g., D + H4) and swing (e.g., W + D + H4) workflows.
**Disclaimer:** This tool is for educational purposes only and is not financial advice. Always validate signals with your own analysis and backtests. Market conditions, data feeds, time zones, slippage, fees, and liquidity can affect outcomes. Past performance does not guarantee future results.
發行說明
- New timeframes: H15 and H5 (toggle alongside Y, M, W, D, H4, H1).- Majority (≥ N) now supports up to N = 8 (auto-clamped to selected TFs).
- Status colors: green ▲ = Bull, red ▼ = Bear, gray = Off.
- Dashboard layout: Column 1 → H4, H1, H15, H5 | Column 2 → Y, M, W, D.
- Logic unchanged: uses prior period’s 50% midpoint; close > midpoint = Bull, else Bear.
發行說明
Bug fixed for H15, H5 to M15, M5受保護腳本
此腳本以閉源形式發佈。 不過,您可以自由且不受任何限制地使用它 — 在此處了解更多資訊。
免責聲明
這些資訊和出版物並不意味著也不構成TradingView提供或認可的金融、投資、交易或其他類型的意見或建議。請在使用條款閱讀更多資訊。
免責聲明
這些資訊和出版物並不意味著也不構成TradingView提供或認可的金融、投資、交易或其他類型的意見或建議。請在使用條款閱讀更多資訊。