PROTECTED SOURCE SCRIPT
Simple Mean Breach .v01
The script is based on moving averages, therefore the underbelly is no different from existing indicators. I've also borrowed ideas from existing scripts. However, this script is meant to help you automate your trading. I removed all the noise of multiple SMA lines, so it's easy to focus on what's important for entering or exiting the position; the top and bottom line at any point in time or price level.
Recommended use and markets:
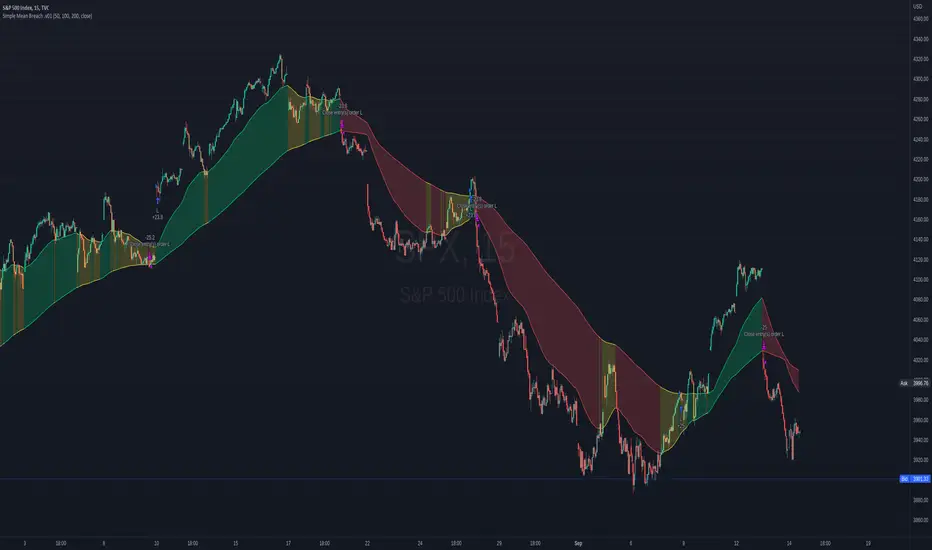
You buy or sell when the price breaches the band. I would recommend focusing on one direction when using this indicator; I prefer going long. This works well with major indices (SPX, NDX, DJI) at 15m or 30m or even 10m, but not the crypto or individual stocks.
Notice that even when the S&P500 is in decline, you can still profit from the occasional powerful rally...if you stick to the script. This script is a visualisation that could help you take emotions out of your trading....you're welcome :)
Recommended use and markets:
You buy or sell when the price breaches the band. I would recommend focusing on one direction when using this indicator; I prefer going long. This works well with major indices (SPX, NDX, DJI) at 15m or 30m or even 10m, but not the crypto or individual stocks.
Notice that even when the S&P500 is in decline, you can still profit from the occasional powerful rally...if you stick to the script. This script is a visualisation that could help you take emotions out of your trading....you're welcome :)
受保護腳本
此腳本以閉源形式發佈。 不過,您可以自由使用,沒有任何限制 — 點擊此處了解更多。
免責聲明
這些資訊和出版物並非旨在提供,也不構成TradingView提供或認可的任何形式的財務、投資、交易或其他類型的建議或推薦。請閱讀使用條款以了解更多資訊。
免責聲明
這些資訊和出版物並非旨在提供,也不構成TradingView提供或認可的任何形式的財務、投資、交易或其他類型的建議或推薦。請閱讀使用條款以了解更多資訊。