OPEN-SOURCE SCRIPT
已更新 Smooth Stochastic and RSI Combo
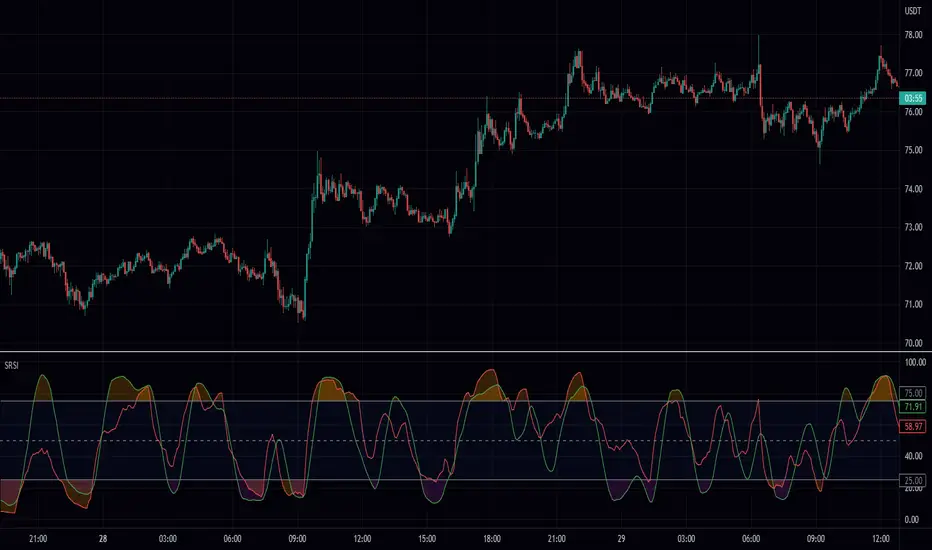
A lot of people run both stochastic and rsi on one chart so I figured I would make something that combines the two. This script takes both the rsi and the stochastic, smooths them both and then plots them both on top of each other. I have filled it to make an error range and I colored it with the direction of its mean. I hope this frees up some room on your screen! Enjoy!
ps this is not stochastic rsi, its both stochastic and rsi.
ps this is not stochastic rsi, its both stochastic and rsi.
發行說明
major color change :) Let me know what you think.發行說明
name fix開源腳本
秉持TradingView一貫精神,這個腳本的創作者將其設為開源,以便交易者檢視並驗證其功能。向作者致敬!您可以免費使用此腳本,但請注意,重新發佈代碼需遵守我們的社群規範。
免責聲明
這些資訊和出版物並非旨在提供,也不構成TradingView提供或認可的任何形式的財務、投資、交易或其他類型的建議或推薦。請閱讀使用條款以了解更多資訊。
開源腳本
秉持TradingView一貫精神,這個腳本的創作者將其設為開源,以便交易者檢視並驗證其功能。向作者致敬!您可以免費使用此腳本,但請注意,重新發佈代碼需遵守我們的社群規範。
免責聲明
這些資訊和出版物並非旨在提供,也不構成TradingView提供或認可的任何形式的財務、投資、交易或其他類型的建議或推薦。請閱讀使用條款以了解更多資訊。