INVITE-ONLY SCRIPT
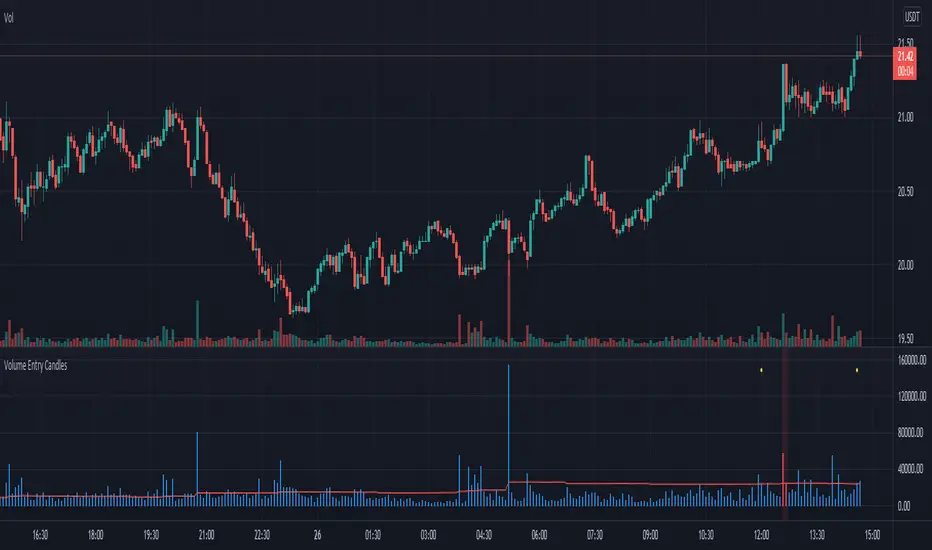
Volume Entry Candles
Introduction
For Wyckoff, three things are important in analyzing the market: price, time, and volume . This indicator provides two types of signals:
- linked to large movements of volumes (red and purple circles on top);
- large price movements concerning volatility (green/red triangle up/down);
In the first case, it highlights the volumes that differ from the most common values, allowing us to trace the levels that the market feels.
Two levels highlight the volume peaks and two calculation methods can be chosen: by exponential moving average or by standard deviation.
In the second case, the signal is based on Volatility and highlights the cases in which the high and low of the last three candles exceed the ATR by a certain number of times. This may indicate situations where the market corrects the price after a fairly large move.
in addition, a table will give us statistical information that tells us:
- from how many candles a condition does not occur
- the average of the candles for which it occurs
- the maximum number of candles for which this condition has not occurred
Obviously, like any statistical tool, it is not intended as absolute certainty
Settings
Analyze all / Minutes: By checking the box, we analyze all the candles in the chart, removing the check will only analyze the period set in minutes.
Type of Level: Select the strategy to calculate the critical levels of the volumes, we can choose Ema or Standard Deviation.
Minimum tail in %: here we can exclude candles where tails aren't enough big, for example if we want to exclude candles without a tail. Use a negative value to ignore this control
We then have three groups:
- the first for the EMA ;
- the second for the Standard Deviation;
- the third for the ATR and its multiplier;
each has configuration parameters such as period and multiplier
Period: length for Ema , or Standard Deviation or ATR function
level1 and level2: they are the multipliers for the two levels
ATR multiplier: multiply the ATR value that must be exceeded by ( high-low ) of the last few candles
n candles: set the number of candles
Help
Show Vol Histogram to fine-tuning: if checked show histogram and lines to tune the indicator
Dimension: to set the histogram dimension
Base: set the price level where we want the histogram, in fact, the histogram is not dynamically displayed, it needs a price to appear
How to use
I follow this step for scalping trading:
- Select time frame 1 minute;
- Personally, I deselect "show the first level", and use only the second level;
- In the candles indicated by the purple circle and I draw a horizontal line on the closing of the candle;
- I can use the levels plotted with time frames at 1min also the time frames at 3min and 5 min
the volatility trigger appears as green/red columns in the histogram.
- green colors indicate a bullish reversal;
- red colors indicate a bearish reversal;
Example Bullish reversal
Moderate risk:
Entry point: above high
Stop loss: below low
High risk:
Entry point: a half body of the trigger candle
Stop loss: 1 ATR below the low of the trigger candle
Tips
Pair this indicator with some Moving Average and/or divergence indicator.
This is the twin of an indicator that I made, called "Volume Analysis". It's better if you prefer to analyze levels by yourself and keep the volume values always visible
免責聲明
這些資訊和出版物並非旨在提供,也不構成TradingView提供或認可的任何形式的財務、投資、交易或其他類型的建議或推薦。請閱讀使用條款以了解更多資訊。