OPEN-SOURCE SCRIPT
Adaptive Candle Signals
█ OVERVIEW
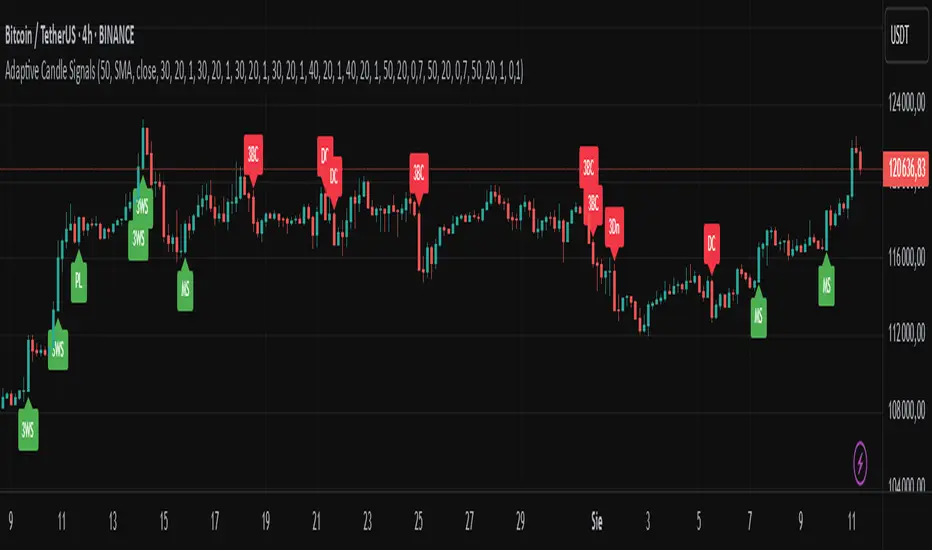
The Adaptive Candle Signals indicator is a Pine Script® tool designed to identify key candlestick patterns on the chart, such as Bullish Engulfing, Bearish Engulfing, Piercing Line, Dark Cloud Cover, Morning Star, Evening Star, Three White Soldiers, Three Black Crows, and Three Inside Up/Down. The indicator allows customization of settings, including a Moving Average (MA) filter, candle size control, and maximum wick percentage, enabling precise adaptation to various trading strategies. Signals are displayed as labels on the chart, and each pattern can trigger alerts for user convenience.
█ CONCEPTS
The indicator is designed with flexibility and readability in mind. Its main features include:
Features
Signal Filtering: Enables the use of a Moving Average (MA) filter to confirm signals based on trend direction. Bullish signals are generated when the price is above the MA, and bearish signals when below.
Pattern Customization: Users can enable or disable individual candlestick patterns and adjust their parameters, such as maximum wick percentage or candle size multiplier. The candle size multiplier applies to the largest candle in the pattern and determines its minimum size relative to the average candle body size over a specified volatility period.
Labels and Colors: Signals are displayed as clear labels with customizable colors for bullish and bearish patterns.
Alerts: Each pattern has a dedicated alert function, facilitating integration with automated trading strategies.
List of Patterns
The indicator recognizes the following candlestick patterns (labels displayed in parentheses):
Bullish Engulfing (BE): Signals a potential upward reversal after a downtrend.
Bearish Engulfing (BE): Indicates a possible downward reversal after an uptrend.
Piercing Line (PL): A bullish pattern suggesting a bounce from support.
Dark Cloud Cover (DC): A bearish pattern indicating a potential downward reversal.
Morning Star (MS): A three-candle bullish pattern signaling an upward reversal.
Evening Star (ES): A three-candle bearish pattern indicating a downward reversal.
Three White Soldiers (3WS): A strong bullish signal based on three large bullish candles.
Three Black Crows (3BC): A strong bearish signal based on three large bearish candles.
Three Inside Up/Down (3Up/3Dn): Patterns indicating trend reversal based on an inside bar structure.
Settings
Settings are organized as follows:
MA Filter: Allows enabling a Moving Average (SMA, EMA, WMA) to filter signals based on trend direction.
Pattern Parameters: Each pattern has its own settings, such as volatility period, candle size multiplier, and maximum wick percentage. The size of the largest candle in the pattern is compared to the average candle body size over the specified volatility period.
Colors and Labels: Users can customize label colors and their distance from candles to improve readability.
█ SETTINGS
Detailed description of the indicator’s settings:
MA Filter:
Use MA Filter: Enables/disables the Moving Average filter.
MA Length: Specifies the period of the Moving Average (default: 50).
MA Type: Choose between SMA, EMA, or WMA.
MA Source: Select the data source (default: close price).
Pattern Settings:
Enable Pattern: Checkbox for each pattern (e.g., Bullish Engulfing, Morning Star).
Maximum Wick Percentage: Defines the maximum allowable wick size as a percentage of the candle body.
Big Candle Filter: Enables/disables checking if the largest candle in the pattern is larger than the average over the specified volatility period.
Volatility Period: Sets the period for calculating the average candle body size.
Candle Multiplier: Multiplier determining the minimum size of the largest candle in the pattern relative to the average candle body size over the specified volatility period.
Appearance:
Signal Text Color: Color of the label text (default: white).
Bullish Label Color: Color for bullish signals (default: green).
Bearish Label Color: Color for bearish signals (default: red).
Label Offset Factor: Controls the distance of labels from candles (from 0.0 to 1.0).
█ HOW TO USE
Add the indicator to your TradingView chart.
Configure the settings in the indicator’s dialog box:
Enable desired candlestick patterns.
Adjust the MA filter parameters to restrict signals to the trend.
Set colors and label offset for better readability.
Enable alerts for selected patterns to receive real-time notifications.
Monitor the labels on the chart and use them alongside other technical analysis tools.
█ LIMITATIONS
The indicator relies on historical price data and may produce false signals in volatile market conditions.
The big candle filter may be less effective on charts with low volatility.
The indicator performs best when combined with other analysis methods, such as support and resistance levels.
開源腳本
秉持TradingView一貫精神,這個腳本的創作者將其設為開源,以便交易者檢視並驗證其功能。向作者致敬!您可以免費使用此腳本,但請注意,重新發佈代碼需遵守我們的社群規範。
免責聲明
這些資訊和出版物並非旨在提供,也不構成TradingView提供或認可的任何形式的財務、投資、交易或其他類型的建議或推薦。請閱讀使用條款以了解更多資訊。
開源腳本
秉持TradingView一貫精神,這個腳本的創作者將其設為開源,以便交易者檢視並驗證其功能。向作者致敬!您可以免費使用此腳本,但請注意,重新發佈代碼需遵守我們的社群規範。
免責聲明
這些資訊和出版物並非旨在提供,也不構成TradingView提供或認可的任何形式的財務、投資、交易或其他類型的建議或推薦。請閱讀使用條款以了解更多資訊。