PROTECTED SOURCE SCRIPT
ADX Cross 30 & EMA 20 Touch Signal
HOLY GRAIL: ADX Cross 30 & EMA 20 Touch Signal
This TradingView script is a powerful tool designed to help traders identify high-probability trend-following opportunities, drawing inspiration from the renowned "HOLY GRAIL" strategy outlined in the Street Smarts book by Linda Bradford Raschke and Laurence A. Connors. It combines the Average Directional Index (ADX) with the Exponential Moving Average (EMA) to generate precise trading signals directly on your chart.
How it Works (Inspired by the "HOLY GRAIL" Strategy):
The script generates a "Buy Signal" when two crucial technical conditions align simultaneously on the same price bar, mirroring the core principles of the "HOLY GRAIL" setup:
ADX Trend Strength Confirmation (ADX Cross Above 30):
The ADX indicator, which measures the strength of a trend (regardless of its direction), crosses above the 30 level.
An ADX reading above 30 typically indicates that a strong and well-defined trend is developing and gaining momentum. This condition filters out choppy or range-bound markets, focusing on clear trending environments, as emphasized in the "HOLY GRAIL" approach.
Price Retest/Interaction with EMA (EMA 20 Touch):
The current price candle (its body or wick) touches or encompasses the 20-period Exponential Moving Average (EMA). This means the low of the candle is at or below the EMA, and the high of the candle is at or above the EMA.
This condition identifies moments within a strong trend where price retraces or consolidates to interact with the EMA, which often acts as a dynamic support or resistance level. This interaction, a key component of the "HOLY GRAIL" strategy, can signal a potential entry point for a continuation of the prevailing trend.
The combination of these two conditions aims to provide a robust signal for trend continuation, ensuring both strong trend presence and a favorable entry point, as per the strategy's design.
Key Features & On-Chart Visuals:
Customizable Parameters:
ADX Length: Easily adjust the lookback period for the ADX calculation (default: 14).
EMA Length: Customize the length of the Exponential Moving Average (default: 20).
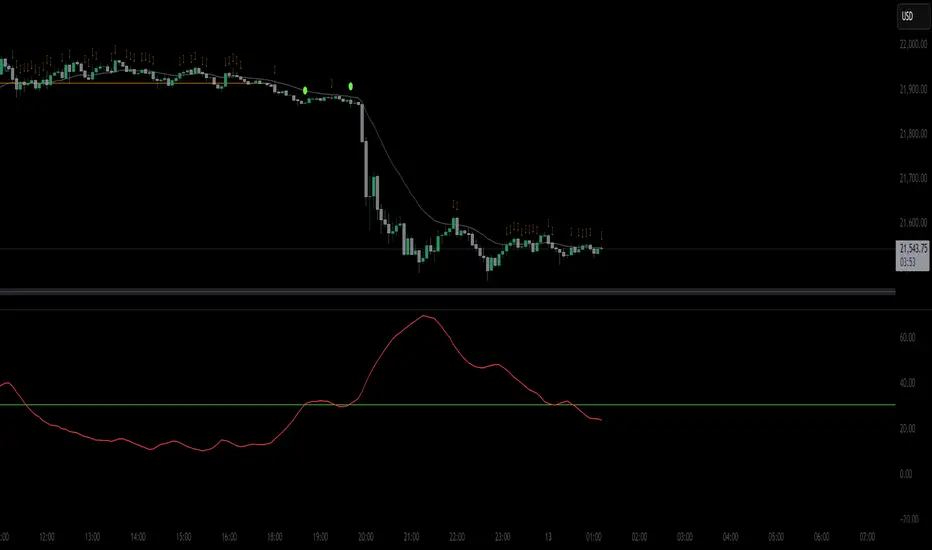
20 EMA Plot: The 20-period EMA is clearly plotted on your main price chart as a prominent dark blue line, making it easy to observe price interaction.
Combined Buy Signal: When both the ADX cross above 30 and the EMA touch conditions are met, a green upward-pointing triangle (▲) is displayed directly below the relevant price bar, indicating a confirmed buy signal.
Background Highlight: The background of the chart is subtly highlighted in a soft green color when a combined buy signal is active, drawing your attention to the signal bar for quick identification.
Debugging & Analysis Aids:
To assist traders in understanding the individual components of the signal and for fine-tuning the indicator, the script includes two helpful debugging plots:
"ADX Cross Only" (Orange Circle (●) above bar): This small orange circle appears above the price bar when only the ADX has crossed above 30, but the EMA touch condition was not met. This helps identify periods of strong trend development without an EMA retest.
"EMA Touch Only" (Purple Square (■) above bar): A small purple square is plotted above the price bar when only the price has touched the 20 EMA, but the ADX has not yet crossed above 30. This highlights instances of EMA interaction without strong trend confirmation.
These debugging plots are invaluable for refining your understanding of the script's logic and for optimizing input parameters for different market conditions.
Important Recommendation for Users:
To gain a deeper insight into the ADX and its directional components (+DI and -DI) and to cross-reference the script's signals, it is strongly recommended to:
Navigate to your TradingView chart.
Click on the "Indicators" or "fx" icon.
Search for and add the built-in "ADX / DMI" indicator to a separate pane below your main chart.
Ensure that its "Length" setting is synchronized with the ADX Length input you are using in this custom script (default 14).
This will provide a clear visual representation of the ADX indicator itself, which is crucial for comprehensive analysis and informed decision-making based on the "HOLY GRAIL" principles.
This TradingView script is a powerful tool designed to help traders identify high-probability trend-following opportunities, drawing inspiration from the renowned "HOLY GRAIL" strategy outlined in the Street Smarts book by Linda Bradford Raschke and Laurence A. Connors. It combines the Average Directional Index (ADX) with the Exponential Moving Average (EMA) to generate precise trading signals directly on your chart.
How it Works (Inspired by the "HOLY GRAIL" Strategy):
The script generates a "Buy Signal" when two crucial technical conditions align simultaneously on the same price bar, mirroring the core principles of the "HOLY GRAIL" setup:
ADX Trend Strength Confirmation (ADX Cross Above 30):
The ADX indicator, which measures the strength of a trend (regardless of its direction), crosses above the 30 level.
An ADX reading above 30 typically indicates that a strong and well-defined trend is developing and gaining momentum. This condition filters out choppy or range-bound markets, focusing on clear trending environments, as emphasized in the "HOLY GRAIL" approach.
Price Retest/Interaction with EMA (EMA 20 Touch):
The current price candle (its body or wick) touches or encompasses the 20-period Exponential Moving Average (EMA). This means the low of the candle is at or below the EMA, and the high of the candle is at or above the EMA.
This condition identifies moments within a strong trend where price retraces or consolidates to interact with the EMA, which often acts as a dynamic support or resistance level. This interaction, a key component of the "HOLY GRAIL" strategy, can signal a potential entry point for a continuation of the prevailing trend.
The combination of these two conditions aims to provide a robust signal for trend continuation, ensuring both strong trend presence and a favorable entry point, as per the strategy's design.
Key Features & On-Chart Visuals:
Customizable Parameters:
ADX Length: Easily adjust the lookback period for the ADX calculation (default: 14).
EMA Length: Customize the length of the Exponential Moving Average (default: 20).
20 EMA Plot: The 20-period EMA is clearly plotted on your main price chart as a prominent dark blue line, making it easy to observe price interaction.
Combined Buy Signal: When both the ADX cross above 30 and the EMA touch conditions are met, a green upward-pointing triangle (▲) is displayed directly below the relevant price bar, indicating a confirmed buy signal.
Background Highlight: The background of the chart is subtly highlighted in a soft green color when a combined buy signal is active, drawing your attention to the signal bar for quick identification.
Debugging & Analysis Aids:
To assist traders in understanding the individual components of the signal and for fine-tuning the indicator, the script includes two helpful debugging plots:
"ADX Cross Only" (Orange Circle (●) above bar): This small orange circle appears above the price bar when only the ADX has crossed above 30, but the EMA touch condition was not met. This helps identify periods of strong trend development without an EMA retest.
"EMA Touch Only" (Purple Square (■) above bar): A small purple square is plotted above the price bar when only the price has touched the 20 EMA, but the ADX has not yet crossed above 30. This highlights instances of EMA interaction without strong trend confirmation.
These debugging plots are invaluable for refining your understanding of the script's logic and for optimizing input parameters for different market conditions.
Important Recommendation for Users:
To gain a deeper insight into the ADX and its directional components (+DI and -DI) and to cross-reference the script's signals, it is strongly recommended to:
Navigate to your TradingView chart.
Click on the "Indicators" or "fx" icon.
Search for and add the built-in "ADX / DMI" indicator to a separate pane below your main chart.
Ensure that its "Length" setting is synchronized with the ADX Length input you are using in this custom script (default 14).
This will provide a clear visual representation of the ADX indicator itself, which is crucial for comprehensive analysis and informed decision-making based on the "HOLY GRAIL" principles.
受保護腳本
此腳本以閉源形式發佈。 不過,您可以自由使用,沒有任何限制 — 點擊此處了解更多。
免責聲明
這些資訊和出版物並非旨在提供,也不構成TradingView提供或認可的任何形式的財務、投資、交易或其他類型的建議或推薦。請閱讀使用條款以了解更多資訊。
受保護腳本
此腳本以閉源形式發佈。 不過,您可以自由使用,沒有任何限制 — 點擊此處了解更多。
免責聲明
這些資訊和出版物並非旨在提供,也不構成TradingView提供或認可的任何形式的財務、投資、交易或其他類型的建議或推薦。請閱讀使用條款以了解更多資訊。