PROTECTED SOURCE SCRIPT
Dynamic Multi-Timeframe Moving Averages Matrix [CdeCripto]
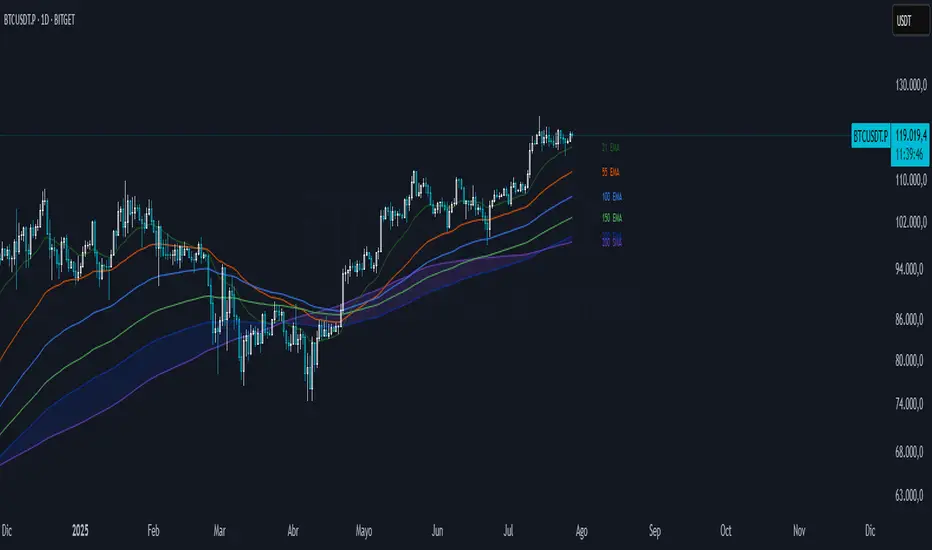
This indicator plots up to 10 customizable moving averages (EMA or SMA) from different timeframes on your chart, with optional colored fills and labels. Perfect for traders who want a clear, consolidated view of multiple trend signals at once.
Key Features
Up to 10 MAs: Independently toggle visibility, length, timeframe and type (EMA/SMA) for each moving average.
Multi-Timeframe Support: Fetches data via request.security, letting you overlay higher- or lower-frame MAs on any chart.
Conditional Fills: Optional translucent fills between adjacent MAs to highlight relative strength—green when the faster MA is above, red when below.
Dynamic Labels: On-chart text boxes showing MA length, period and type—fully configurable colour and size for quick reference.
Clean, Lightweight Code: Highly commented and optimized for performance; minimal risk of hitting TradingView’s line/label limits.
Inputs
MA Visibility: Show/hide each of the 10 moving averages.
Length & Type: Set period (e.g. 50, 200) and choose EMA or SMA.
Timeframe: Specify any built-in or custom timeframe (e.g. 1h, 4h, D, W, M).
Colour & Style: Pick distinct colours for each MA; adjust line width and style.
Fill Options: Toggle fills between MA1–MA2, MA2–MA3, … MA9–MA10 and set fill transparency.
Label Options: Turn labels on/off, override label colour, choose font size.
Usage
Scan multiple trend horizons at a glance—ideal for strategies that combine short, medium and long-term moving average signals.
Spot regime changes: when a shorter‐term MA crosses above/below a longer-term MA, the colored fill instantly highlights the shift.
Keep your chart tidy: show only the MAs and fills you need, hide the rest.
How to Add
Copy the Pine Script code into a new indicator in TradingView’s Pine Editor.
Click “Add to Chart.”
Open the settings panel to customize each MA, fills, and labels.
Disclaimer: For educational purposes only. Not financial advice.
受保護腳本
此腳本以閉源形式發佈。 不過,您可以自由使用,沒有任何限制 — 點擊此處了解更多。
免責聲明
這些資訊和出版物並非旨在提供,也不構成TradingView提供或認可的任何形式的財務、投資、交易或其他類型的建議或推薦。請閱讀使用條款以了解更多資訊。
免責聲明
這些資訊和出版物並非旨在提供,也不構成TradingView提供或認可的任何形式的財務、投資、交易或其他類型的建議或推薦。請閱讀使用條款以了解更多資訊。