OPEN-SOURCE SCRIPT
Dynamic Gamma Inspired Indicator
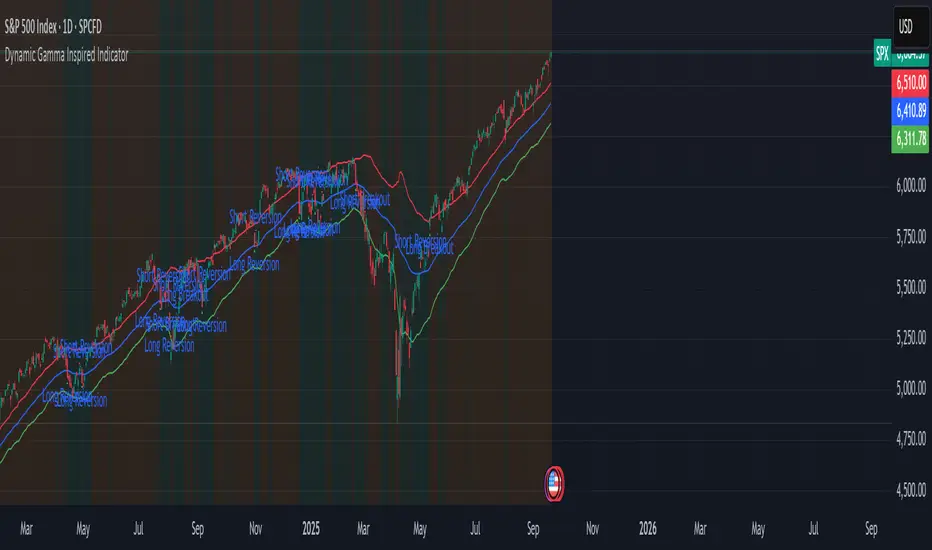
Dynamic Gamma Inspired Indicator
This indicator identifies potential market regime shifts between low-volatility (mean-reverting) and high-volatility (trending) environments by using a dynamic, volatility-adaptive framework inspired by options market gamma exposure concepts.
Core Concepts
This indicator uses a volatility-based model that mimics how market maker hedging can influence price stability and volatility. While it's not possible to calculate true Gamma Exposure (GEX) in Pine Script without external options data, this script uses the Average True Range (ATR) as a proxy to create dynamic zones that adapt to current market conditions.
Positive Gamma Environment (Green Background) When price is contained within the upper and lower walls, it suggests a period of stability where market makers' hedging may suppress volatility. In this "mean-reversion" regime, prices tend to revert to the central pivot.
Negative Gamma Environment (Orange Background) When price breaks outside the walls, it signals a potential increase in volatility, where hedging can amplify price moves. This "trend-amplification" regime suggests the potential for strong breakout or trend-following moves.
How It Works
The indicator is built on three key components that dynamically adjust to market volatility:
Dynamic Pivot (Blue Line) An Exponential Moving Average (EMA) acts as the central "zero gamma" pivot point.
Dynamic Walls (Red & Green Lines) These upper and lower bands are calculated by adding or subtracting a multiple of the Average True Range (ATR) from the central EMA pivot. This is similar to how Keltner Channels use ATR to create volatility-based envelopes. The walls expand during high volatility and contract during low volatility.
How to Use This Indicator
The indicator automatically plots signals based on the current market regime:
Mean-Reversion Signals (Inside the Walls)
Long Reversion: Appears when the price crosses up through the central pivot, suggesting a potential move toward the upper wall.
Short Reversion: Appears when the price crosses down through the central pivot, suggesting a potential move toward the lower wall.
Breakout Signals (Outside the Walls)
Long Breakout: Appears when the price breaks and closes above the upper wall, signaling the start of a potential uptrend.
Short Breakout: Appears when the price breaks and closes below the lower wall, signaling the start of a potential downtrend.
Customization
You can tailor the indicator to different assets and timeframes by adjusting the following inputs:
Central Pivot EMA Length: Determines the period for the central moving average.
ATR Length for Walls: Sets the lookback period for the Average True Range calculation.
ATR Multiplier for Walls: Adjusts the width of the channel. A larger multiplier creates wider walls, filtering out more noise but providing fewer signals.
Disclaimer: This indicator is a tool for analysis and should not be used as a standalone trading signal. Always use proper risk management and combine it with other analysis methods. Past performance is not indicative of future results.
開源腳本
秉持TradingView一貫精神,這個腳本的創作者將其設為開源,以便交易者檢視並驗證其功能。向作者致敬!您可以免費使用此腳本,但請注意,重新發佈代碼需遵守我們的社群規範。
免責聲明
這些資訊和出版物並非旨在提供,也不構成TradingView提供或認可的任何形式的財務、投資、交易或其他類型的建議或推薦。請閱讀使用條款以了解更多資訊。
免責聲明
這些資訊和出版物並非旨在提供,也不構成TradingView提供或認可的任何形式的財務、投資、交易或其他類型的建議或推薦。請閱讀使用條款以了解更多資訊。