OPEN-SOURCE SCRIPT
已更新 Long Term Levels (4h, D, W, M, Q, & Y)
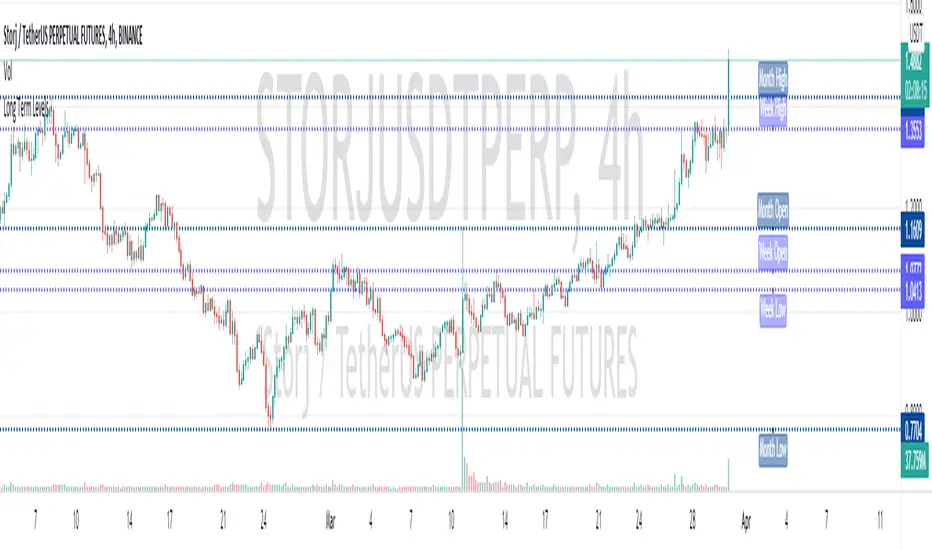
This shows and labels the highs and lows from the previous 4h, daily, weekly, monthly, quarterly and yearly session. By default it only shows weekly, monthly and yearly. It also has an option to use small labels (M vs Monthly High) to save your eyeballs. You may need to adjust your charts right hand margin to see them properly.
Everything is shown in very tasteful shades of blue. For a faster loading version of this check my other indicators.
Everything is shown in very tasteful shades of blue. For a faster loading version of this check my other indicators.
發行說明
Fixed indicator title發行說明
Updated to v5, and made it a bit faster with less security() calls開源腳本
秉持TradingView一貫精神,這個腳本的創作者將其設為開源,以便交易者檢視並驗證其功能。向作者致敬!您可以免費使用此腳本,但請注意,重新發佈代碼需遵守我們的社群規範。
免責聲明
這些資訊和出版物並非旨在提供,也不構成TradingView提供或認可的任何形式的財務、投資、交易或其他類型的建議或推薦。請閱讀使用條款以了解更多資訊。
開源腳本
秉持TradingView一貫精神,這個腳本的創作者將其設為開源,以便交易者檢視並驗證其功能。向作者致敬!您可以免費使用此腳本,但請注意,重新發佈代碼需遵守我們的社群規範。
免責聲明
這些資訊和出版物並非旨在提供,也不構成TradingView提供或認可的任何形式的財務、投資、交易或其他類型的建議或推薦。請閱讀使用條款以了解更多資訊。