OPEN-SOURCE SCRIPT
FVG
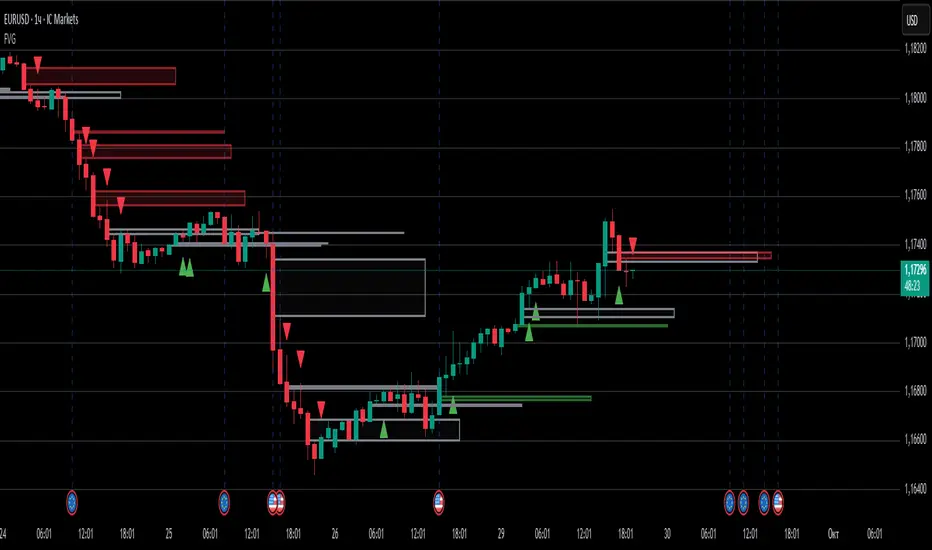
FVG (Fair Value Gap) Indicator
The Fair Value Gap (FVG) indicator is a powerful tool designed to identify price imbalance zones that often act as critical support and resistance levels in the market. An FVG occurs when there is a gap between the high of one candle and the low of another candle two periods away, creating an unfilled price area that the market tends to revisit. These zones represent areas where institutional orders may be waiting and can provide high-probability trading opportunities.
This indicator automatically detects both bullish and bearish FVGs across any selected timeframe while ensuring complete reliability with no repainting. It uses only confirmed bar data with lookahead protection, making it suitable for live trading and backtesting. The tool features customizable visual elements including zone colors, transparency levels, and timeframe labels, along with automatic mitigation tracking that monitors when FVGs get filled by price action.
Key features include multi-timeframe analysis, extending zones to the right for ongoing relevance, flexible display options for both active and mitigated FVGs, and built-in alert system for new FVG formations. The indicator also provides comprehensive labeling options and maintains a clean chart by automatically managing the maximum number of displayed zones, making it an essential tool for traders following smart money concepts and institutional trading strategies.
開源腳本
本著TradingView的真正精神,此腳本的創建者將其開源,以便交易者可以查看和驗證其功能。向作者致敬!雖然您可以免費使用它,但請記住,重新發佈程式碼必須遵守我們的網站規則。
免責聲明
這些資訊和出版物並不意味著也不構成TradingView提供或認可的金融、投資、交易或其他類型的意見或建議。請在使用條款閱讀更多資訊。
開源腳本
本著TradingView的真正精神,此腳本的創建者將其開源,以便交易者可以查看和驗證其功能。向作者致敬!雖然您可以免費使用它,但請記住,重新發佈程式碼必須遵守我們的網站規則。
免責聲明
這些資訊和出版物並不意味著也不構成TradingView提供或認可的金融、投資、交易或其他類型的意見或建議。請在使用條款閱讀更多資訊。