OPEN-SOURCE SCRIPT
RSI v4 with Bands
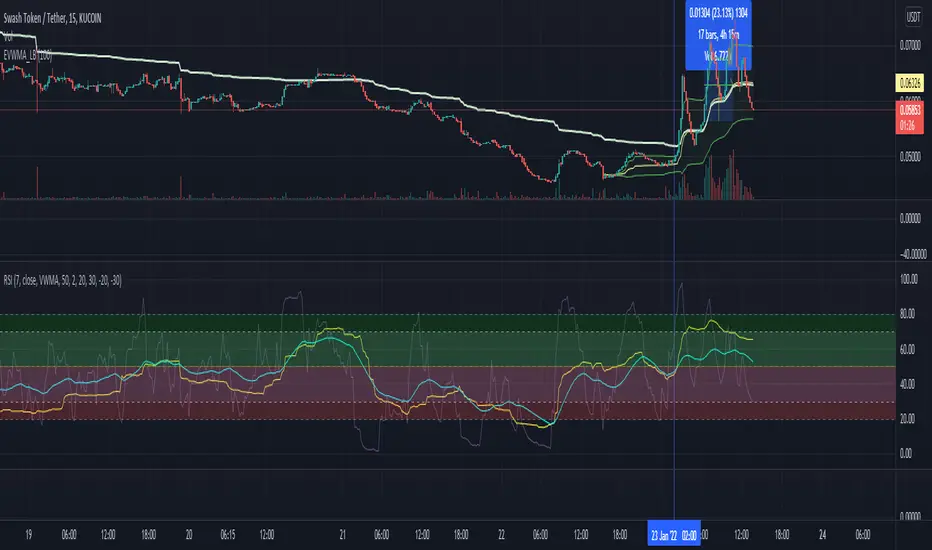
- Script is extended version of usual RSI script
This script plots VWMA(RSI7) [default colored orange] vs EMA(RSI7) [default colored blue] under pre-set time frame.
Strategy is to make sure both points remain in the Green zone while entering into BUY position
Use it as indicator not as financial advice.
~ imbharat
開源腳本
秉持TradingView一貫精神,這個腳本的創作者將其設為開源,以便交易者檢視並驗證其功能。向作者致敬!您可以免費使用此腳本,但請注意,重新發佈代碼需遵守我們的社群規範。
免責聲明
這些資訊和出版物並非旨在提供,也不構成TradingView提供或認可的任何形式的財務、投資、交易或其他類型的建議或推薦。請閱讀使用條款以了解更多資訊。
免責聲明
這些資訊和出版物並非旨在提供,也不構成TradingView提供或認可的任何形式的財務、投資、交易或其他類型的建議或推薦。請閱讀使用條款以了解更多資訊。