INVITE-ONLY SCRIPT
Breakout of inclined trendline [Drobode]
█ DESCRIPTION
The script is designed to automatically detect a possible trendline breakout under the conditions of the popular "Slanted Trendline Breakout" strategy. The algorithm assumes that during the movement the price approaches the slanted (trend) line several times. With each subsequent approach (touch) to the trend line, the price consolidates more and more near this line, the distances between the extremes (touches) decrease, which indicates a high probability of a breakout of this line. The script checks the number of touches (approaches) of the extremes and the distances between the extremes. If all conditions are met, the script draws a slanted (trend) line in the corresponding area and an arrow with a possible price breakout direction. The length of the arrow is half the height of the slanted (trend) line and may indicate the level (price) at which it is advisable to fix the profit. In the script, you can enable or disable additional analysis periods (history length, number of bars), the more periods are enabled, the slower the script may load. For example, when placing the script on M-15, we can additionally enable the period 300 or 500, which will allow us to take into account a larger number of historical bars, and this can be considered as the extremes of the older timeframe. The script calculates each period separately, so one large period will not be able to take into account and analyze smaller periods. You can set the percentage deviation of the distance of the extremes from the trend line that touch the inclined line, depending on your needs and style of technical analysis. The smaller the percentage, the more accurate and closer to the inclined line the price extreme should be and vice versa. The main goal of the script is to facilitate the trader's routine work of identifying a possible trend line breakout. However, it should be understood that the script is not a full-fledged self-sufficient strategy, in case of receiving a signal, it is recommended to additionally conduct a comprehensive thorough analysis before taking trading actions. The script can be useful for traders of all levels, both beginners and experienced analysts. Like any other strategy or script, this script can work better on some instruments than on others. When analyzing trading setups, it is desirable to have a clear trend, it is recommended to take into account the signal of this script with a small period when the arrow shows the direction of the trend. However, at the same time, it is necessary to deeply analyze many other factors at this stage, in particular, such as volumes, consolidation, volatility, candlestick patterns, etc.
█ SCRIPT SETTINGS
Alert
The Alert function in the script is enabled by default, you just need to activate Alert in the TradingView window and select the signal source - Breakout of inclined trendline [Drobode].
The notification provides the following information (example):
Periods length
The script allows you to set the length of the period (number of bars) for which the calculation will be performed. Different periods allow you to cover more timeframes (in particular, larger timeframes). You can change up to 4 periods at a time. However, if you choose too large periods, the script may slow down and the loading time will increase. To increase the loading speed of the script, disable additional periods 3, 4, i.e. uncheck the corresponding checkboxes and use only fields 1 and 2 for periods, where you can also set the period length you need.
Percentage deviation of extremes from the trend line
The next settings are the percentage deviation of the extremes from the sloping line. The smaller the deviation, the more accurate and closer to the line the extreme bars should be, however, in this case the number of identification signals will be smaller. By default, the rejection zone is - 0.15%. On larger timeframes, the deviation can be set to be larger.
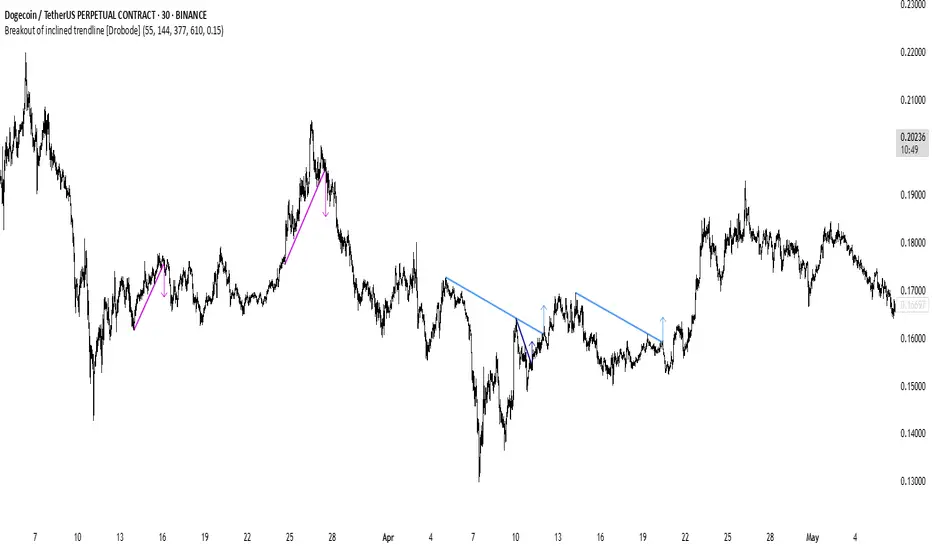
The script is designed to automatically detect a possible trendline breakout under the conditions of the popular "Slanted Trendline Breakout" strategy. The algorithm assumes that during the movement the price approaches the slanted (trend) line several times. With each subsequent approach (touch) to the trend line, the price consolidates more and more near this line, the distances between the extremes (touches) decrease, which indicates a high probability of a breakout of this line. The script checks the number of touches (approaches) of the extremes and the distances between the extremes. If all conditions are met, the script draws a slanted (trend) line in the corresponding area and an arrow with a possible price breakout direction. The length of the arrow is half the height of the slanted (trend) line and may indicate the level (price) at which it is advisable to fix the profit. In the script, you can enable or disable additional analysis periods (history length, number of bars), the more periods are enabled, the slower the script may load. For example, when placing the script on M-15, we can additionally enable the period 300 or 500, which will allow us to take into account a larger number of historical bars, and this can be considered as the extremes of the older timeframe. The script calculates each period separately, so one large period will not be able to take into account and analyze smaller periods. You can set the percentage deviation of the distance of the extremes from the trend line that touch the inclined line, depending on your needs and style of technical analysis. The smaller the percentage, the more accurate and closer to the inclined line the price extreme should be and vice versa. The main goal of the script is to facilitate the trader's routine work of identifying a possible trend line breakout. However, it should be understood that the script is not a full-fledged self-sufficient strategy, in case of receiving a signal, it is recommended to additionally conduct a comprehensive thorough analysis before taking trading actions. The script can be useful for traders of all levels, both beginners and experienced analysts. Like any other strategy or script, this script can work better on some instruments than on others. When analyzing trading setups, it is desirable to have a clear trend, it is recommended to take into account the signal of this script with a small period when the arrow shows the direction of the trend. However, at the same time, it is necessary to deeply analyze many other factors at this stage, in particular, such as volumes, consolidation, volatility, candlestick patterns, etc.
█ SCRIPT SETTINGS
By default, the script was developed and tested on medium timeframes with cryptocurrency futures instruments USDT.P
Alert
The Alert function in the script is enabled by default, you just need to activate Alert in the TradingView window and select the signal source - Breakout of inclined trendline [Drobode].
The notification provides the following information (example):
- Possible breakout to the upside
- Ticker- DOGEUSDT.P
- Price- 0.15844
- Timeframe- 30
- Period length- 377
Periods length
The script allows you to set the length of the period (number of bars) for which the calculation will be performed. Different periods allow you to cover more timeframes (in particular, larger timeframes). You can change up to 4 periods at a time. However, if you choose too large periods, the script may slow down and the loading time will increase. To increase the loading speed of the script, disable additional periods 3, 4, i.e. uncheck the corresponding checkboxes and use only fields 1 and 2 for periods, where you can also set the period length you need.
Percentage deviation of extremes from the trend line
The next settings are the percentage deviation of the extremes from the sloping line. The smaller the deviation, the more accurate and closer to the line the extreme bars should be, however, in this case the number of identification signals will be smaller. By default, the rejection zone is - 0.15%. On larger timeframes, the deviation can be set to be larger.
僅限邀請腳本
僅作者批准的使用者才能訪問此腳本。您需要申請並獲得使用許可,通常需在付款後才能取得。更多詳情,請依照作者以下的指示操作,或直接聯絡Drobode。
TradingView不建議在未完全信任作者並了解其運作方式的情況下購買或使用腳本。您也可以在我們的社群腳本中找到免費的開源替代方案。
作者的說明
To access the script, you need to go to the website https://tradescripttools.vercel.app/en
Trading tools for technical analysis. Thanks to advanced settings, you can experiment with different variations of accuracy and periods for calculations. You can choose the best variations for a specific instrument or timeframe. To access, follow the we
免責聲明
這些資訊和出版物並非旨在提供,也不構成TradingView提供或認可的任何形式的財務、投資、交易或其他類型的建議或推薦。請閱讀使用條款以了解更多資訊。