OPEN-SOURCE SCRIPT
已更新 Fisher MPz
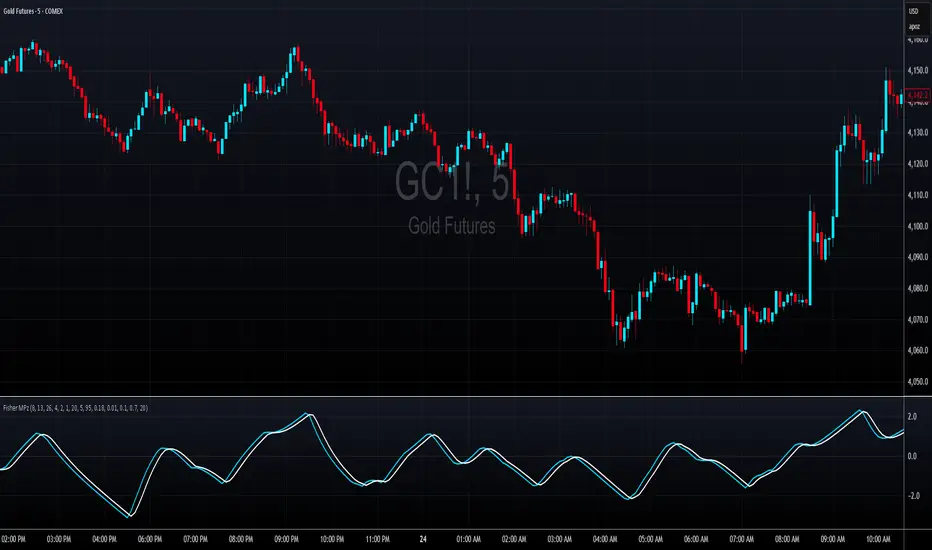
Fisher MPz - Multi-Period Z-Score Fisher Transform
Overview
An enhanced Fisher Transform that uses multi-period analysis and improved statistical methods to provide more reliable trading signals with the goal of fewer false positives.
Evolution Beyond Traditional Fisher Transform
While the classic Fisher Transform uses simple price normalization and basic smoothing, Fisher MPz introduces several key enhancements:
- Multi-period composite instead of single timeframe analysis
- Robust z-score normalization using median/MAD rather than mean/standard deviation
- Winsorization to handle outliers and price spikes
- Dynamic clipping that adapts to market volatility
- Kalman filtering for superior noise reduction vs. traditional EMA smoothing
These improvements result in cleaner signals, better adaptability to different market conditions, handles trending markets without over-saturation at extreme values, and reduced false signals compared to the standard Fisher Transform.
Key Features
Multi-Period Analysis
- Three Timeframe Approach: Simultaneously analyzes short (default 8), medium (default 13), and long (default 26) periods
- Weighted Composite: Combines all three periods using customizable weights for optimal signal generation
- Individual Period Display: Optional visualization of each period's Fisher Transform for deeper analysis
Advanced Statistical Methods
Robust Z-Score Calculation
- Uses median and MAD (Median Absolute Deviation) instead of mean and standard deviation
- More resistant to outliers and extreme price movements
- Provides stable normalization across varying market conditions
Winsorization
- Caps extreme price values at specified percentiles (default 5th and 95th)
- Reduces the impact of price spikes and anomalies
- Configurable lookback period for threshold calculation
Dynamic Z-Score Clipping
- Automatically adjusts clipping levels based on recent volatility
- Tighter bounds in calm markets (0.05) for precision
- Wider bounds in volatile markets (0.2) to capture significant moves
- Uses ATR-based volatility measurement
Kalman Filter Smoothing
- Optional advanced noise reduction using Kalman filtering
- Superior to traditional EMA smoothing for optimal signal extraction
- Configurable process noise (Q) and measurement noise (R) parameters
- Fallback to traditional smoothing factor available
How to Use
Basic Interpretation
- Above Zero: Bullish momentum
- Below Zero: Bearish momentum
- Extreme Values: Potential overbought/oversold conditions
- Crossovers: Entry/exit signals when composite crosses trigger line
Customizable Settings
Periods: Adjust based on your trading timeframe
- Lower values (3-10): More sensitive, suitable for scalping
- Medium values (10-20): Balanced for swing trading
- Higher values (20-50): Smoother for position trading
Weights: Customize responsiveness
- Increase short weight: More reactive to recent price changes
- Increase long weight: More stability and trend confirmation
Kalman Settings
- Lower Q (0.001-0.02): Smoother, more filtered signals
- Higher Q (0.02-0.1): More responsive to price changes
- Lower R (0.01-0.05): Trust data more, less filtering
- Higher R (0.1-1.0): More skeptical of data, more smoothing
發行說明
Added new visual style開源腳本
秉持TradingView一貫精神,這個腳本的創作者將其設為開源,以便交易者檢視並驗證其功能。向作者致敬!您可以免費使用此腳本,但請注意,重新發佈代碼需遵守我們的社群規範。
discord.gg/REapC6SGtz
b3artrades@gmail.com
b3artrades@gmail.com
免責聲明
這些資訊和出版物並非旨在提供,也不構成TradingView提供或認可的任何形式的財務、投資、交易或其他類型的建議或推薦。請閱讀使用條款以了解更多資訊。
開源腳本
秉持TradingView一貫精神,這個腳本的創作者將其設為開源,以便交易者檢視並驗證其功能。向作者致敬!您可以免費使用此腳本,但請注意,重新發佈代碼需遵守我們的社群規範。
discord.gg/REapC6SGtz
b3artrades@gmail.com
b3artrades@gmail.com
免責聲明
這些資訊和出版物並非旨在提供,也不構成TradingView提供或認可的任何形式的財務、投資、交易或其他類型的建議或推薦。請閱讀使用條款以了解更多資訊。