OPEN-SOURCE SCRIPT
TRAX Detrended Price Strategy
In this script, the "TRAX" (TRIX) indicator is calculated using the Volume Weighted Moving Average (VWMA) instead of Exponential Moving Average (EMA) like the standard TRIX. The Detrended Price is used to identify short term cycles with a rate of change verses the rate of change from a triple smoothed TRAX VWMA . The strategy is intended for counter-trend trading, meaning it tries to capture potential reversals.
1. Indicators Used:
TRAX is calculated using the Volume Weighted Moving Average (VWMA) of the logarithm of the closing price.
DPO (Detrended Price Oscillator) is calculated by taking the closing price and subtracting a simple moving average (SMA) of the closing price shifted back.
2. Crossover Conditions:
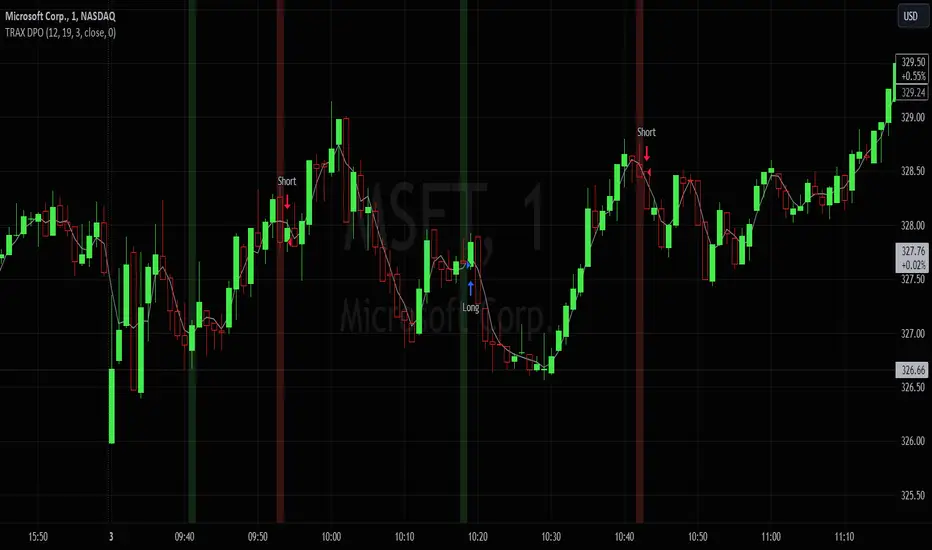
Longs occur when DPO crosses above the TRAX, with the TRAX trending below 0, and the stock is trading above an adjustable simple moving average. Shorts occur due to the inverse conditions.
3. Visualization:
This script plots the SMA and the TRAX-DPO Combined Oscillator.
It highlights the periods of zero-line crossover using a green background for potential long positions and a red background for potential short positions. However, it will trigger verified entries/exits in accordance with the SMA.
In conclusion, this fun prototype underwent a unique alteration using the Volume Weighted Moving Average and focuses on capturing shorter counter-trend cycles. You have the freedom to fine-tune the strategy by adjusting parameters and incorporating other analysis methods that resonate with your trading style and risk tolerance.
1. Indicators Used:
TRAX is calculated using the Volume Weighted Moving Average (VWMA) of the logarithm of the closing price.
DPO (Detrended Price Oscillator) is calculated by taking the closing price and subtracting a simple moving average (SMA) of the closing price shifted back.
2. Crossover Conditions:
Longs occur when DPO crosses above the TRAX, with the TRAX trending below 0, and the stock is trading above an adjustable simple moving average. Shorts occur due to the inverse conditions.
3. Visualization:
This script plots the SMA and the TRAX-DPO Combined Oscillator.
It highlights the periods of zero-line crossover using a green background for potential long positions and a red background for potential short positions. However, it will trigger verified entries/exits in accordance with the SMA.
In conclusion, this fun prototype underwent a unique alteration using the Volume Weighted Moving Average and focuses on capturing shorter counter-trend cycles. You have the freedom to fine-tune the strategy by adjusting parameters and incorporating other analysis methods that resonate with your trading style and risk tolerance.
開源腳本
秉持TradingView一貫精神,這個腳本的創作者將其設為開源,以便交易者檢視並驗證其功能。向作者致敬!您可以免費使用此腳本,但請注意,重新發佈代碼需遵守我們的社群規範。
KP
免責聲明
這些資訊和出版物並非旨在提供,也不構成TradingView提供或認可的任何形式的財務、投資、交易或其他類型的建議或推薦。請閱讀使用條款以了解更多資訊。
免責聲明
這些資訊和出版物並非旨在提供,也不構成TradingView提供或認可的任何形式的財務、投資、交易或其他類型的建議或推薦。請閱讀使用條款以了解更多資訊。