OPEN-SOURCE SCRIPT
已更新 Fixed Fibonacci Support Resistance
I took the formula of the fibonacci from LonesomeTheBlue and made this script. You can take a look at his indicator here: 
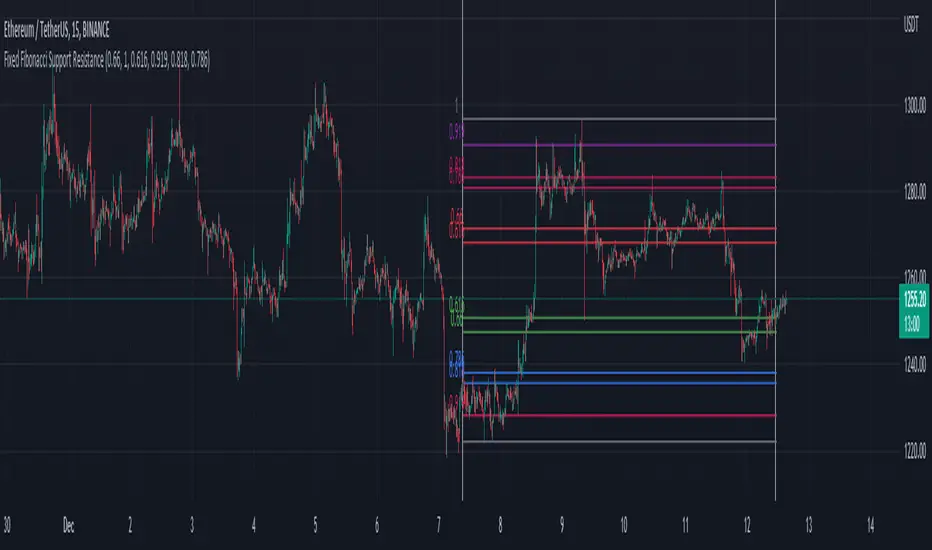
When you first add the indicator on the chart, click on the chart to select the first date and then the second date. It will then calculate the fibonacci support and resistance of the range you choose. You can also choose the date inside the inputs.
Be sure the first date is before the second date, otherwise it won't be able to show the fibonacci. If that happen, choose a correct date in the inputs.
發行說明
The original code is from LonesomeTheBlue in the Fibonacci Levels MTF script.發行說明
-Added a bool to extend the fibonacci to the right. -I changed the fibonacci to start from start time to end time instead of starting at end time.
-Added a bool to show/hide the start/end white line.
開源腳本
秉持TradingView一貫精神,這個腳本的創作者將其設為開源,以便交易者檢視並驗證其功能。向作者致敬!您可以免費使用此腳本,但請注意,重新發佈代碼需遵守我們的社群規範。
免責聲明
這些資訊和出版物並非旨在提供,也不構成TradingView提供或認可的任何形式的財務、投資、交易或其他類型的建議或推薦。請閱讀使用條款以了解更多資訊。
免責聲明
這些資訊和出版物並非旨在提供,也不構成TradingView提供或認可的任何形式的財務、投資、交易或其他類型的建議或推薦。請閱讀使用條款以了解更多資訊。