OPEN-SOURCE SCRIPT
已更新 [blackcat] L3 MACD plus Candles
Level: 3
Background
Many people need to judge the market trend against the main candlestick chart when using MACD.
Function
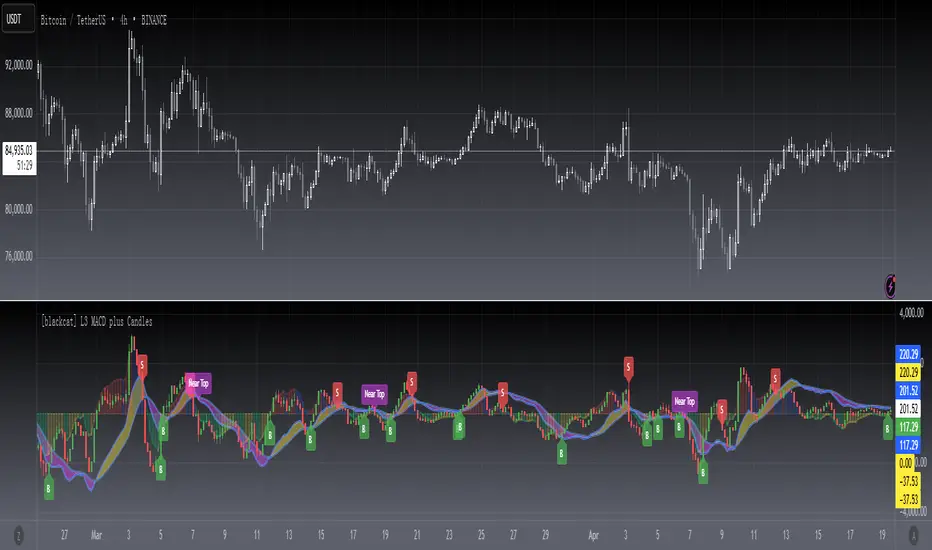
First of all, the principle of MACD is the difference between EMA's long-term and short-term values. So, I wonder if it is possible to use EMA to construct a set of candle charts that are similar in proportion to MACD values for overlapping comparisons? Because this can greatly facilitate traders to make quick trend judgments. So I used the 3-8 lines of EMA to simulate the KD of KDJ, constructed a set of candle charts, and generated buying and selling points through conditional constraints. Do you like this MACD + Candlestick chart?
Inputs
N/A
Key Signal
Traditional MACD output signal
Candlesticks
Near Top --> Top is reached and reversal may happen soon. (fuchsia labels)
Near Bottom --> Bottom is reached and reversal may happen soon. (yellow labels)
Remarks
This is a Level 3 free and open source indicator.
Feedbacks are appreciated.
Background
Many people need to judge the market trend against the main candlestick chart when using MACD.
Function
First of all, the principle of MACD is the difference between EMA's long-term and short-term values. So, I wonder if it is possible to use EMA to construct a set of candle charts that are similar in proportion to MACD values for overlapping comparisons? Because this can greatly facilitate traders to make quick trend judgments. So I used the 3-8 lines of EMA to simulate the KD of KDJ, constructed a set of candle charts, and generated buying and selling points through conditional constraints. Do you like this MACD + Candlestick chart?
Inputs
N/A
Key Signal
Traditional MACD output signal
Candlesticks
Near Top --> Top is reached and reversal may happen soon. (fuchsia labels)
Near Bottom --> Bottom is reached and reversal may happen soon. (yellow labels)
Remarks
This is a Level 3 free and open source indicator.
Feedbacks are appreciated.
發行說明
OVERVIEWThe [blackcat] L3 MACD plus Candles indicator combines Moving Average Convergence Divergence (MACD) with Exponential Moving Averages (EMA) to provide a comprehensive view of market trends and potential reversal points. This indicator plots MACD lines, histograms, and custom candlesticks based on EMA differences, helping traders identify buy and sell signals more effectively 📊💹.
FEATURES
Calculates and plots MACD Line, Signal Line, and Histogram
Plots custom candlesticks based on EMA differences:
Green for bullish conditions.
Red for bearish conditions.
Identifies and plots near-top and near-bottom zones using MACD crossovers 🏆⬇️
Generates clear buy ('B') and sell ('S') labels on the chart for easy visualization 🏷️
Provides alerts for buy and sell signals to aid in timely decision-making 🔔
Supports customizable colors and line widths for plotted elements ⚙️
HOW TO USE
Add the indicator to your TradingView chart by selecting it from the indicators list.
Observe the plotted MACD lines, histograms, and custom candlesticks on the chart.
Monitor the generated buy ('B') and sell ('S') labels indicating potential trade opportunities.
Set up alerts based on the generated signals to receive notifications when conditions are met 📲.
Combine this indicator with other tools for confirmation before making trading decisions.
LIMITATIONS
The indicator relies heavily on MACD and EMAs, which might not capture all market nuances.
False signals can occur in ranging or sideways markets 🌪️.
Users should always confirm signals with other forms of analysis.
NOTES
Ensure that you have sufficient historical data available for accurate calculations.
Test the indicator thoroughly on demo accounts before applying it to live trading 🔍.
Customize the appearance of the plotted elements as needed to fit your preferences.
開源腳本
秉持TradingView一貫精神,這個腳本的創作者將其設為開源,以便交易者檢視並驗證其功能。向作者致敬!您可以免費使用此腳本,但請注意,重新發佈代碼需遵守我們的社群規範。
Avoid losing contact!Don't miss out! The first and most important thing to do is to join my Discord chat now! Click here to start your adventure: discord.com/invite/ZTGpQJq 防止失联,请立即行动,加入本猫聊天群: discord.com/invite/ZTGpQJq
免責聲明
這些資訊和出版物並非旨在提供,也不構成TradingView提供或認可的任何形式的財務、投資、交易或其他類型的建議或推薦。請閱讀使用條款以了解更多資訊。