OPEN-SOURCE SCRIPT
HersG High Low Bar Charts Layout
Hello friends,
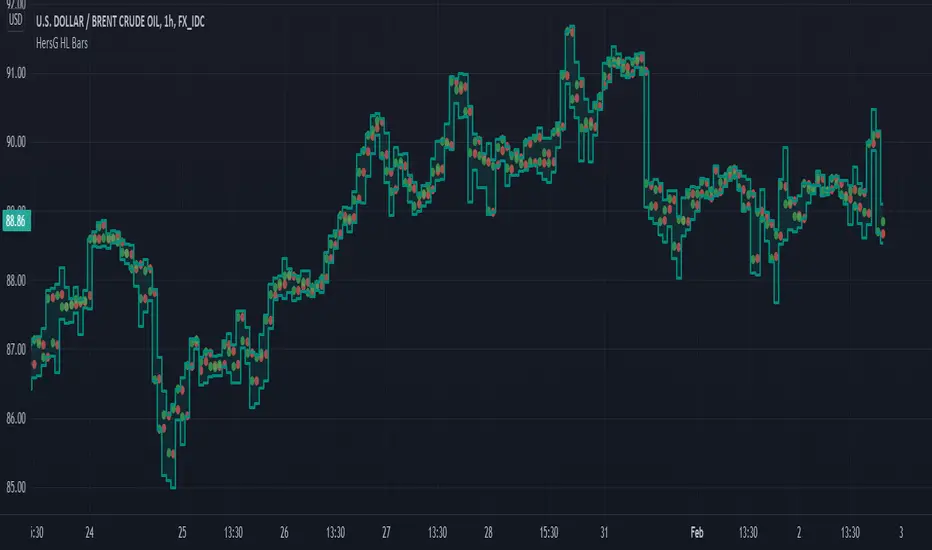
The following indicator will create a new form of chart layout in High & Low as candle-like full bars instead of Open and Close. There are no wicks, only full bars highlighting High and Low of the select time frame. Two dots inside a bar will represent Open (Red dot) and Close (Green dot).
How can it help you as a trader?
High and Low candle-like bars will clear the noise from charts in identifying support & resistance, higher-highs and lower-lows will be clearly visible thus helping you make trades.
First add the indicator and then hover the mouse pointer over the ticker in the charts and click on the “eye-shaped” symbol to hide the candlesticks chart pattern.
The type of chart layout is standard charts. Data are not re-calculated or manipulated.
Regards!
開源腳本
秉持TradingView一貫精神,這個腳本的創作者將其設為開源,以便交易者檢視並驗證其功能。向作者致敬!您可以免費使用此腳本,但請注意,重新發佈代碼需遵守我們的社群規範。
免責聲明
這些資訊和出版物並非旨在提供,也不構成TradingView提供或認可的任何形式的財務、投資、交易或其他類型的建議或推薦。請閱讀使用條款以了解更多資訊。
開源腳本
秉持TradingView一貫精神,這個腳本的創作者將其設為開源,以便交易者檢視並驗證其功能。向作者致敬!您可以免費使用此腳本,但請注意,重新發佈代碼需遵守我們的社群規範。
免責聲明
這些資訊和出版物並非旨在提供,也不構成TradingView提供或認可的任何形式的財務、投資、交易或其他類型的建議或推薦。請閱讀使用條款以了解更多資訊。