OPEN-SOURCE SCRIPT
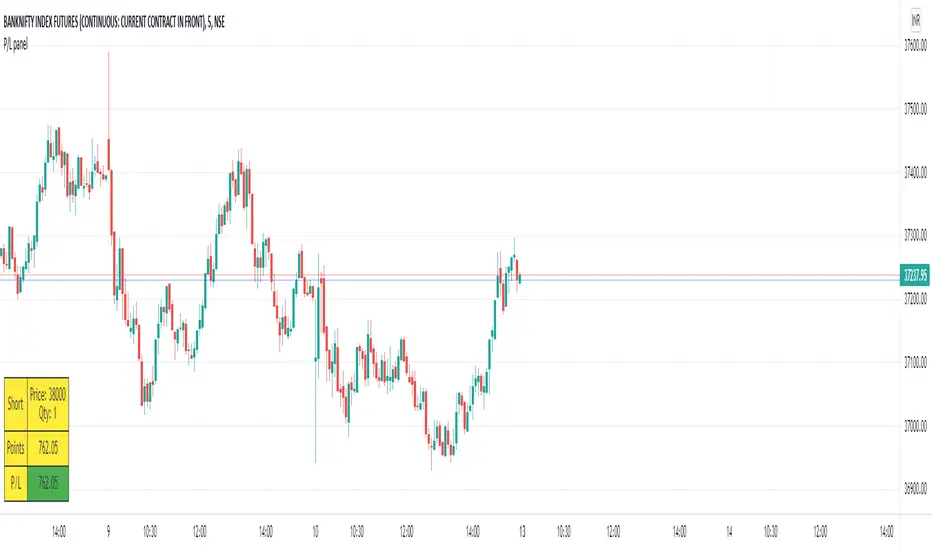
P/L panel
This is not a indicator or strategy.
I thought of having a table showing running profit or loss on chart from a specific price.
I tried to put the same in code and ended up with this code.
This is a table showing the running profit or loss from a manually specified price and quantity.
when you add the code, This table asks us to input the entry price and quantity.
It will calculate the running profit or loss with respect to running price and puts that in the table.
We will have to input two things.
1.) entry price: the price at which a position(long/short) is taken.
2.) Quantity: A +value need to be entered for Long position and -value for short position.
code detects whether its a long position or short position based on the quantity info.
for example if a LONG position is taken at a price 60 of 100 quantity,
then in price we need to enter 60
and in quantity 100 (+ve value)
for SHORT position at a price of 60 of 100 quantity,
in price we need to enter 60
and in quantity -100 (-ve value)
once the table is added to the chart.
Just double click on the table, it will open the settings tab and we can provide new inputs price/quantity/position.
positioning of table is optional and all possible positioning options are provided.
Advise further improvements required if any in this code.
This piece of code can be used along with any indicator.
For which we may need to use valuewhen() additionally.
Try it yourself and ping me if required.
開源腳本
本著TradingView的真正精神,此腳本的創建者將其開源,以便交易者可以查看和驗證其功能。向作者致敬!雖然您可以免費使用它,但請記住,重新發佈程式碼必須遵守我們的網站規則。
免責聲明
這些資訊和出版物並不意味著也不構成TradingView提供或認可的金融、投資、交易或其他類型的意見或建議。請在使用條款閱讀更多資訊。
開源腳本
本著TradingView的真正精神,此腳本的創建者將其開源,以便交易者可以查看和驗證其功能。向作者致敬!雖然您可以免費使用它,但請記住,重新發佈程式碼必須遵守我們的網站規則。
免責聲明
這些資訊和出版物並不意味著也不構成TradingView提供或認可的金融、投資、交易或其他類型的意見或建議。請在使用條款閱讀更多資訊。