OPEN-SOURCE SCRIPT
Hull Oscillator
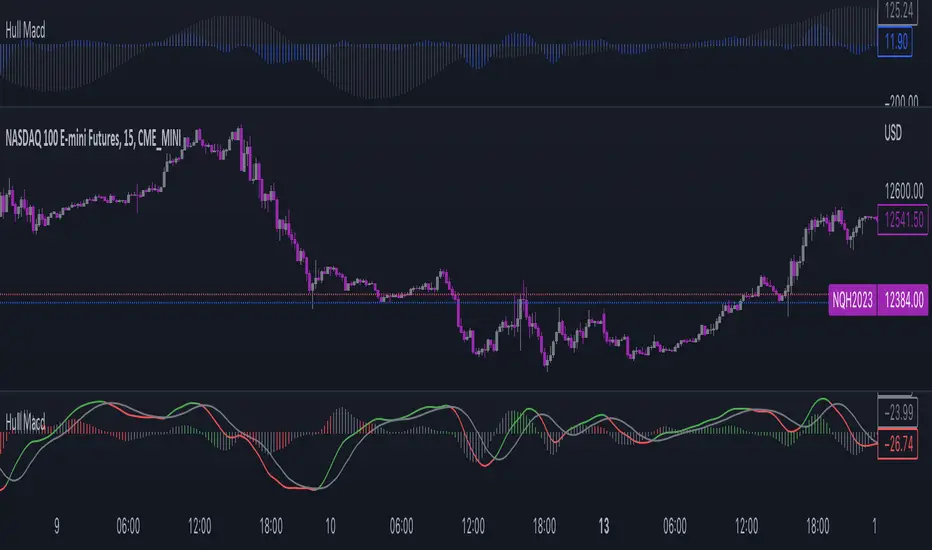
This oscillator comprehends two different indicators:
- The first one is a MACD but calculated using the Hull Moving Average.
- The second one is to show the direction in which the Hull Moving Average is going.
Notice that in the first indicator, the histogram is colored as follows:
- If the volume pressure (difference between the volume-weighted moving average and the normal one) is positive both for the short term and the long term, it's green, if negative it's red, and if not is simply gray.
This tool can be used both for:
- Analyze the direction to have a bias to follow
- Analyze the divergences
- Obtain the signal to enter and exit the trade
- Analyze the market strength with volume to confirm the signal
開源腳本
秉持TradingView一貫精神,這個腳本的創作者將其設為開源,以便交易者檢視並驗證其功能。向作者致敬!您可以免費使用此腳本,但請注意,重新發佈代碼需遵守我們的社群規範。
免責聲明
這些資訊和出版物並非旨在提供,也不構成TradingView提供或認可的任何形式的財務、投資、交易或其他類型的建議或推薦。請閱讀使用條款以了解更多資訊。
開源腳本
秉持TradingView一貫精神,這個腳本的創作者將其設為開源,以便交易者檢視並驗證其功能。向作者致敬!您可以免費使用此腳本,但請注意,重新發佈代碼需遵守我們的社群規範。
免責聲明
這些資訊和出版物並非旨在提供,也不構成TradingView提供或認可的任何形式的財務、投資、交易或其他類型的建議或推薦。請閱讀使用條款以了解更多資訊。