PROTECTED SOURCE SCRIPT
已更新 COT-Index (Trader Sentiment Tracker)
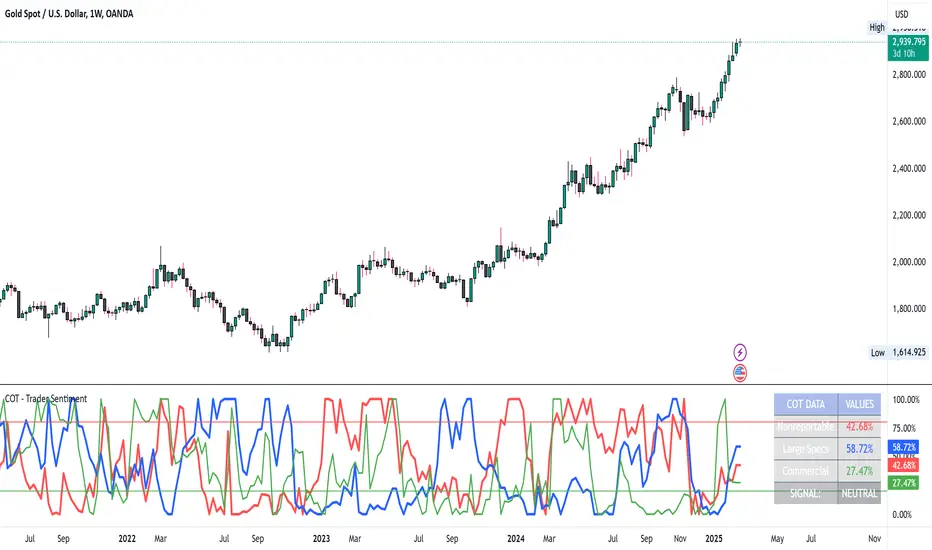
The COT Data with Speculator Indices indicator provides insights into market sentiment based on the Commitments of Traders (COT) report. It analyzes and visualizes the positions of different market participants (e.g., large speculators, commercial traders, and nonreportable positions) over a specific period (default: 26 weeks). The indicator calculates indices for each group, ranging from 0 to 100, indicating whether positions are extreme or neutral.
It includes customizable thresholds to highlight bearish (above 80%) and bullish (below 20%) zones, with visual cues (lines and background color changes) to mark market extremes. The indicator also displays the current COT data in a table and provides real-time signals based on the market sentiment, helping traders assess the potential market direction.
Key features:
Displays COT data for large speculators, commercial traders, and nonreportable positions.
Visualizes market extremes with background shading.
Provides real-time sentiment signals.
Customizable thresholds for bullish and bearish signals.
This indicator is useful for traders who want to gauge market sentiment using the COT report and make informed decisions based on trader positioning.
發行說明
fixed Bugs受保護腳本
此腳本以閉源形式發佈。 不過,您可以自由使用,沒有任何限制 — 點擊此處了解更多。
免責聲明
這些資訊和出版物並非旨在提供,也不構成TradingView提供或認可的任何形式的財務、投資、交易或其他類型的建議或推薦。請閱讀使用條款以了解更多資訊。
受保護腳本
此腳本以閉源形式發佈。 不過,您可以自由使用,沒有任何限制 — 點擊此處了解更多。
免責聲明
這些資訊和出版物並非旨在提供,也不構成TradingView提供或認可的任何形式的財務、投資、交易或其他類型的建議或推薦。請閱讀使用條款以了解更多資訊。