INVITE-ONLY SCRIPT
已更新 Nifty 500 Scanner
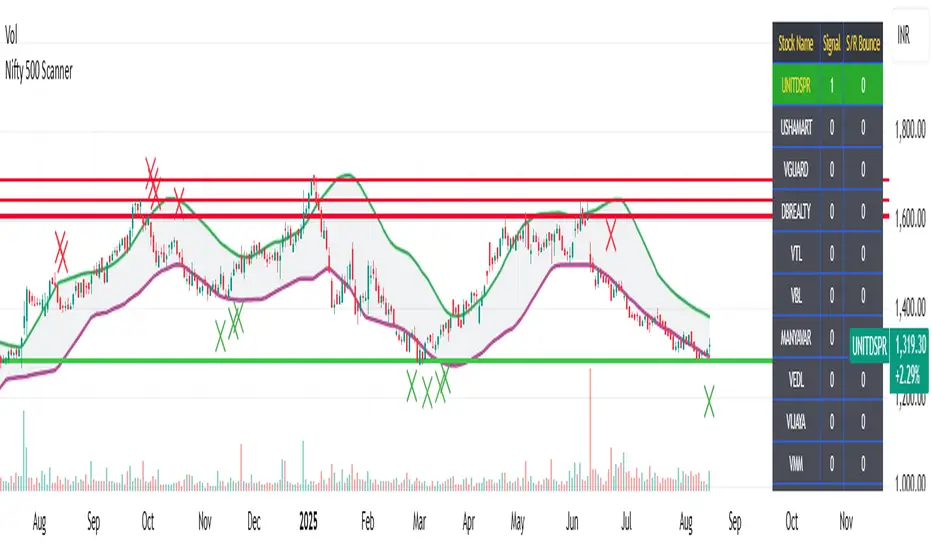
Nifty 500 Scanner
Your Ultimate TradingView Tool for Swing and Intraday Trading
🔥 Introduction
✅ If you want to find out which stock out of 500 stocks of Nifty500 is:
- [✅ ] showing reversal pattern candles after a long down or up trend
[✅ ] also bouncing from support/resistance
[✅ ] and that stock gives you live alerts when this condition occurs
[✅ ] Then, look no further. Nifty500 Scanner is just for you.
📊 What is the Nifty 500 Scanner?
The Nifty 500 Scanner is a powerful TradingView indicator for Indian stocks designed to help you identify bullish and bearish reversal signals across all timeframes. Whether you are an intraday trader or a swing trader, this tool gives you an edge by scanning predefined groups of Nifty 500 stocks and visually showing you high-probability setups.
🔥 Key Features
- Scans all Nifty 500 stocks in batches of 25 (20 groups in total). Takes less than 10 minutes to select bearish or bullish reversal stocks out of 500 stocks.
- Detects over 50 advanced candlestick patterns, divergences, and trend changes in one go in all the selected stocks and displays result right on your chart in the form of a table.
- Auto-populated real-time table display with signal count and color-coded results.
- TradingView alerts for instant notification of reversal setups.
- Shows key support and resistance levels for each stock.
- Fully compatible with all timeframes – from 1 minutes to monthly chart.
✅ Why Traders Would Love It?
- [✅ ] Eliminates manual chart scanning – saves hours every week.
[✅ ] Improves trade accuracy by filtering out weak setups.
[✅ ] Instantly tells you which stocks to trade tomorrow (if using after market hours)
[✅ ] Built for Indian market conditions and TradingView users.
⚙️ How It Works?
- Select a stock group from the dropdown menu (Available in indicator settings).
- Suppose you select Group1 and press OK, voila.. the scanner automatically runs through 25 predefined Nifty 500 stocks and updates the table in quick time.
- The table shows which stocks are giving bullish or bearish signals and also tells you how many such signals are there. The more signals, the more conviction for upcoming reversal.
- Open chart of any stock mentioned in the table to have a detailed look.
- The chart will show you a consolidation zone, support/resistance lines automatically.
- Set up alerts for your favorite stocks and let TradingView notify you when new signals emerge for that particular stock.
📌 Important Notes
Stock groups are hard-coded into the script and cannot be modified by the user.
Custom versions for other countries or indices (e.g., S&P 500, FTSE) can be created upon request.
🔍 Optimized For
Swing traders and intraday traders seeking high-probability setups.
Technical analysts using TradingView to analyze Indian stock charts.
Traders looking for an advanced reversal signal scanner.
🚀 Ready to Trade Smarter?
Start using the Nifty 500 Scanner on TradingView and never miss a reversal signal again.
Get Access Now.
發行說明
Update: The logic of signal generation updated to be more precise.僅限邀請腳本
只有經作者批准的使用者才能訪問此腳本。您需要申請並獲得使用權限。該權限通常在付款後授予。如欲了解更多詳情,請依照以下作者的說明操作,或直接聯絡jellygill。
除非您完全信任其作者並了解腳本的工作原理,否則TradingView不建議您付費或使用腳本。您也可以在我們的社群腳本中找到免費的開源替代方案。
作者的說明
Nifty500 scanners allows you to find out stocks (out of 500 pre-defined Nifty500 stocks):
which are showing reversal pattern candles after a long down or up trend, and which are bouncing from support/resistance line. You can set up alerts also.
提醒:在請求訪問權限之前,請閱讀僅限邀請腳本指南。
To avail FREE TRIAL for all our invite-only indicators, please contact us:
Telegram: @jellygill
Our Telegram Channel: @CheetaTrader
join to complete FREE TRAINING on how to use the indicators effectively and then request @jellygill for FREE TRIAL
Telegram: @jellygill
Our Telegram Channel: @CheetaTrader
join to complete FREE TRAINING on how to use the indicators effectively and then request @jellygill for FREE TRIAL
免責聲明
這些資訊和出版物並不意味著也不構成TradingView提供或認可的金融、投資、交易或其他類型的意見或建議。請在使用條款閱讀更多資訊。
僅限邀請腳本
只有經作者批准的使用者才能訪問此腳本。您需要申請並獲得使用權限。該權限通常在付款後授予。如欲了解更多詳情,請依照以下作者的說明操作,或直接聯絡jellygill。
除非您完全信任其作者並了解腳本的工作原理,否則TradingView不建議您付費或使用腳本。您也可以在我們的社群腳本中找到免費的開源替代方案。
作者的說明
Nifty500 scanners allows you to find out stocks (out of 500 pre-defined Nifty500 stocks):
which are showing reversal pattern candles after a long down or up trend, and which are bouncing from support/resistance line. You can set up alerts also.
提醒:在請求訪問權限之前,請閱讀僅限邀請腳本指南。
To avail FREE TRIAL for all our invite-only indicators, please contact us:
Telegram: @jellygill
Our Telegram Channel: @CheetaTrader
join to complete FREE TRAINING on how to use the indicators effectively and then request @jellygill for FREE TRIAL
Telegram: @jellygill
Our Telegram Channel: @CheetaTrader
join to complete FREE TRAINING on how to use the indicators effectively and then request @jellygill for FREE TRIAL
免責聲明
這些資訊和出版物並不意味著也不構成TradingView提供或認可的金融、投資、交易或其他類型的意見或建議。請在使用條款閱讀更多資訊。