OPEN-SOURCE SCRIPT
已更新 Roger & Satchell Estimator Historical Volatility Bands [Loxx]
Roger & Satchell Estimator Historical Volatility Bands [Loxx] are constructed using:
What is Roger & Satchell Estimator Historical Volatility?
The Rogers–Satchell estimator does not handle opening jumps; therefore, it underestimates the volatility. It accurately explains the volatility portion that can be attributed entirely to a trend in the price evolution. Rogers and Satchell try to embody the frequency of price observations in the model in order to overcome the drawback. They claim that the corrected estimator outperforms the uncorrected one in a study based on simulated data.
RSEHV = sqrt((Z/n) * sum((log(high/close)*log(high/open)) + (log(low/close)*log(low/open))))
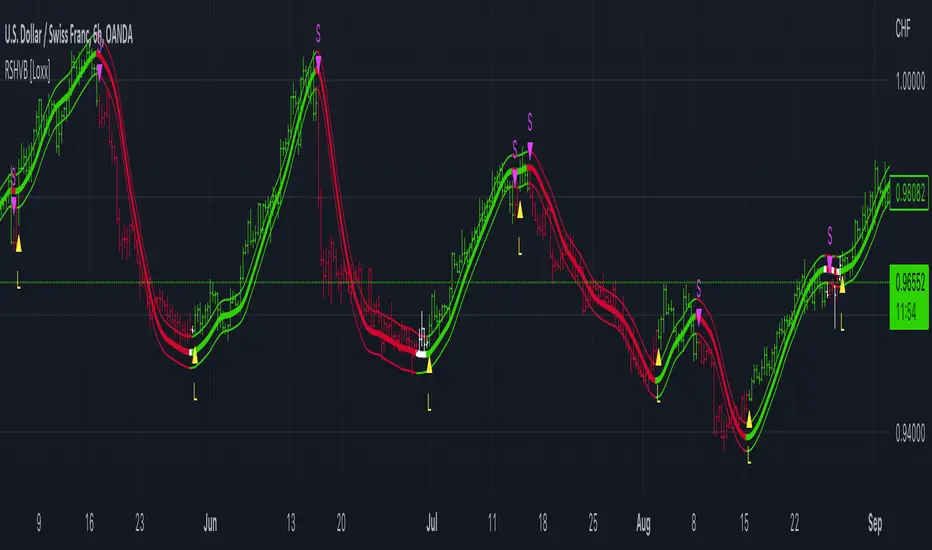
The color of the middle line, unlike the bands colors, has 3 colors. When colors of the bands are the same, then the middle line has the same color, otherwise it's white.
Included
- Average as the middle line.
- Upper and lower bands using theRoger & Satchell Estimator Historical Volatility Bands for bands calculation.
What is Roger & Satchell Estimator Historical Volatility?
The Rogers–Satchell estimator does not handle opening jumps; therefore, it underestimates the volatility. It accurately explains the volatility portion that can be attributed entirely to a trend in the price evolution. Rogers and Satchell try to embody the frequency of price observations in the model in order to overcome the drawback. They claim that the corrected estimator outperforms the uncorrected one in a study based on simulated data.
RSEHV = sqrt((Z/n) * sum((log(high/close)*log(high/open)) + (log(low/close)*log(low/open))))
The color of the middle line, unlike the bands colors, has 3 colors. When colors of the bands are the same, then the middle line has the same color, otherwise it's white.
Included
- Alerts
- Signals
- Loxx's Expanded Source Types
- Bar coloring
發行說明
Updated to handle all timeframes. This calculation is without annualized modification so that it's relevant to the current timeframe only.開源腳本
秉持TradingView一貫精神,這個腳本的創作者將其設為開源,以便交易者檢視並驗證其功能。向作者致敬!您可以免費使用此腳本,但請注意,重新發佈代碼需遵守我們的社群規範。
Public Telegram Group, t.me/algxtrading_public
VIP Membership Info: patreon.com/algxtrading/membership
VIP Membership Info: patreon.com/algxtrading/membership
免責聲明
這些資訊和出版物並非旨在提供,也不構成TradingView提供或認可的任何形式的財務、投資、交易或其他類型的建議或推薦。請閱讀使用條款以了解更多資訊。
開源腳本
秉持TradingView一貫精神,這個腳本的創作者將其設為開源,以便交易者檢視並驗證其功能。向作者致敬!您可以免費使用此腳本,但請注意,重新發佈代碼需遵守我們的社群規範。
Public Telegram Group, t.me/algxtrading_public
VIP Membership Info: patreon.com/algxtrading/membership
VIP Membership Info: patreon.com/algxtrading/membership
免責聲明
這些資訊和出版物並非旨在提供,也不構成TradingView提供或認可的任何形式的財務、投資、交易或其他類型的建議或推薦。請閱讀使用條款以了解更多資訊。