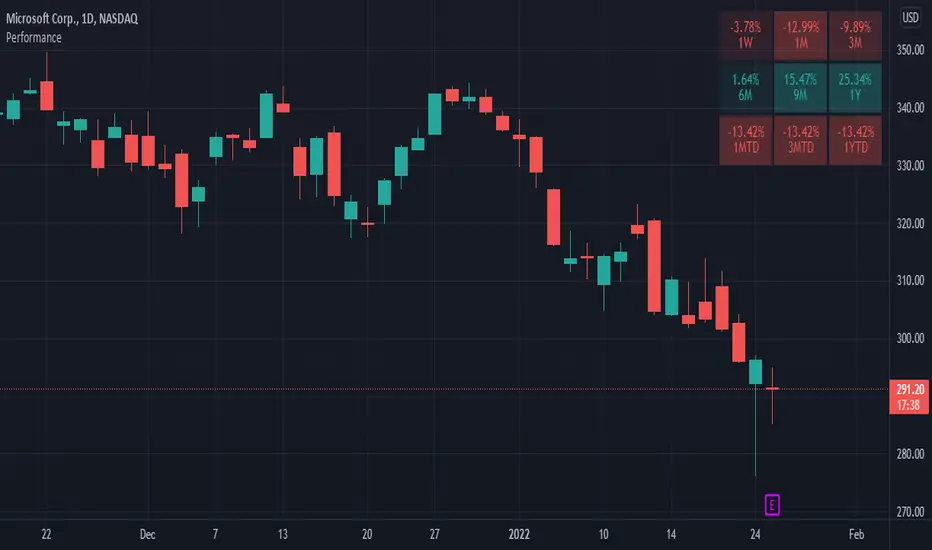
This indicator is based on the Performance section in the TradingView's sidebar and uses new Pine tables functionality. It compares the current price of the symbol to its past price and calculates the rate of return to make it easier to track the performance of the symbol. Note that the Performance sidebar is not updated in real-time, while this indicator is, so on real-time charts the values between the two can differ (the indicator's values are more recent).
The formula of the calculation is (Current value - Past value) * 100 / Past value, where Past value is:
The formula of the calculation is (Current value - Past value) * 100 / Past value, where Past value is:
- 1W - close 5 daily bars ago
- 1M - close 21 daily bars ago
- 3M - close 63 daily bars ago
- 6M - close 126 daily bars ago
- YTD - close of the past year
- 1Y - close 251 daily bars ago
發行說明
Made a number of functional improvements:- Changed the calculation algorithm to fit what TV is using right now. It works better on all types of charts, including crypto, unlike the previous one, that was tied to the number of working days.
- Added customizable timeframes. It is now possible to set up to 6 different 'Absolute' timeframes and up to 3 'To Date' ones (intraday timeframes are not supported). New timeframes can be added via the chart's Timeframe dropdown - add the custom timeframe there and it will also appear in the indicator's settings. Note that not added timeframes show up as "Chart" until you add them.
- Added an option to customize the width of the table. The height will adjust automatically.
- Converted to Pine v5.
P.S. Let me know if you encounter any issues with the new version.
開源腳本
秉持TradingView一貫精神,這個腳本的創作者將其設為開源,以便交易者檢視並驗證其功能。向作者致敬!您可以免費使用此腳本,但請注意,重新發佈代碼需遵守我們的社群規範。
免責聲明
這些資訊和出版物並非旨在提供,也不構成TradingView提供或認可的任何形式的財務、投資、交易或其他類型的建議或推薦。請閱讀使用條款以了解更多資訊。
免責聲明
這些資訊和出版物並非旨在提供,也不構成TradingView提供或認可的任何形式的財務、投資、交易或其他類型的建議或推薦。請閱讀使用條款以了解更多資訊。