OPEN-SOURCE SCRIPT
Retrospective Candlestick Chart
When i was in Japan with some traders colleagues we talked about traditional charting tools from this country and how they changed the way we look at our charts today. Then suddenly one of the japanese traders i have met earlier said "Why not making another charting tool ? Smoother than Heikin-Ashi and including all the information a trader may need but easier to interpret".
So i had the idea of averaging the input and the output of the respective close/open/high and low price using a recursive exponential window functions, each values will be closer to their true value if they are volatile, if they are not then those values will look smoother, the length input represents the reactivity of the candles, high values represents smoother results but less reactive.The goal of those candles is to make all the information easier to interpret by a trader.

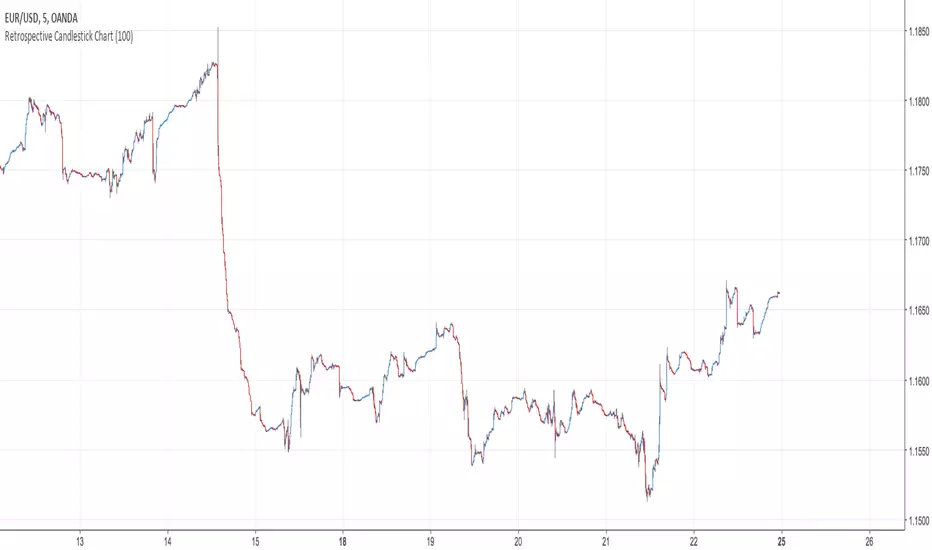
500 input length, the price look smoother, supports and resistances are easier to make.

The interpretation of highs and lows are important, the Retrospective Candlestick Chart save you time by showing only huge movements.
So i had the idea of averaging the input and the output of the respective close/open/high and low price using a recursive exponential window functions, each values will be closer to their true value if they are volatile, if they are not then those values will look smoother, the length input represents the reactivity of the candles, high values represents smoother results but less reactive.The goal of those candles is to make all the information easier to interpret by a trader.
500 input length, the price look smoother, supports and resistances are easier to make.
The interpretation of highs and lows are important, the Retrospective Candlestick Chart save you time by showing only huge movements.
開源腳本
本著TradingView的真正精神,此腳本的創建者將其開源,以便交易者可以查看和驗證其功能。向作者致敬!雖然您可以免費使用它,但請記住,重新發佈程式碼必須遵守我們的網站規則。
Check out the indicators we are making at luxalgo: tradingview.com/u/LuxAlgo/
"My heart is so loud that I can't hear the fireworks"
"My heart is so loud that I can't hear the fireworks"
免責聲明
這些資訊和出版物並不意味著也不構成TradingView提供或認可的金融、投資、交易或其他類型的意見或建議。請在使用條款閱讀更多資訊。