OPEN-SOURCE SCRIPT
已更新 [blackat] L2 Bull and Bear Heaven Line
OVERVIEW
The [blackat] L2 Bull and Bear Heaven Line script is a custom indicator designed to visualize trend directions using Exponential Moving Average (EMA)-based lines and generate trade signals based on crossovers between those lines. It also incorporates an RSI-like feature to provide additional insight into overbought and oversold conditions.
FEATURES
Utilizes two EMAs: a longer-term "Heaven Line" (default 60 bars) and a shorter-term "Trading Line" (default 30 bars).
Generates buy/sell signals based on crossovers between the "Trading Line" and "Heaven Line".
Identifies potential turning points in the market, indicating shifts from bullish to bearish or vice versa.
Includes an "Operation Line" similar to RSI, aiding in detecting overbought/oversold levels.
HOW TO USE
Add the script to your TradingView chart.
Observe the crossovers between the "Trading Line" and "Heaven Line":
Buy signal when the "Trading Line" crosses above the "Heaven Line".
Sell signal when the "Trading Line" crosses below the "Heaven Line".
Monitor the "Operation Line" for additional confirmation:
Secondary sell signal when the "Operation Line" drops below 90% and there is downward price action.
Complementary buy signal when the "Operation Line" rises above 10% and there is upward price action.
Consider the identified trend direction and potential turning points to make informed trading decisions.
LIMITATIONS
The effectiveness of the signals depends on the chosen time frame and specific market conditions.
False signals may occur due to volatile price movements or rapid changes in market sentiment.
NOTES
This script combines traditional technical analysis tools like EMAs with an RSI-like approach to enhance decision-making processes. Users should backtest the strategy under various market scenarios before implementing it in live trading.
THANKS
Special thanks to the contributors whose work inspired parts of this script.
發行說明
Hey there, fellow traders! I've got something exciting to share with you today – the "L2 Bull and Bear Heaven Line" indicator. Imagine being able to navigate the treacherous waters of the stock market like a seasoned sailor, thanks to some cleverly crafted lines guiding your way. That’s exactly what this indicator aims to do!At its core, this script uses two Exponential Moving Averages (EMAs): one longer-term ("Heaven Line") and one shorter-term ("Trading Line"). The interplay between these lines helps identify potential trend reversals and momentum shifts. When the Trading Line crosses above the Heaven Line, it's like seeing daylight after a storm—time to consider buying! Conversely, when it dips below, it might be time to think about selling.
But wait, there's more! This indicator also sports Bull and Bear Lines, which visually highlight whether the current mood is optimistic or pessimistic. Plus, it introduces a concept called the "Operation Line," which seems to measure the market's confidence level, giving additional clues for entering or exiting trades.
One particularly intriguing feature is the "Golden Cross," where the Trading Line breaches the Heaven Line upwards, signaling a possible bull run ahead. On the flip side, breaking below could indicate a bearish phase.
To make things even cooler, the script includes specific signals marked with arrows, making it super easy to spot entry and exit points without getting lost in a sea of data. And let's not forget the "Bullish Turnaround" candlesticks, painted in fuchsia, adding a splash of color—and maybe optimism—to your charts.
So, whether you're a veteran trader looking for new tools or just starting out on your journey, this indicator promises to provide valuable insights into market dynamics. Just remember to adjust those periods (m and n) according to your preferred strategy; they can significantly influence how these lines behave.
In summary, this isn't just another moving average crossover system—it's a comprehensive tool designed to help you stay informed about market trends, pinpointing opportunities amidst chaos. Happy trading!
發行說明
OVERVIEW📈 [blackat] L2 Bull and Bear Heaven Line is an advanced TradingView indicator that helps traders identify potential price reversals and trend changes. This script combines moving averages and custom calculations to provide clear buy/sell signals and turnaround points.
FEATURES
Customizable Heaven Line and Trading Line periods
Dynamic calculation of Bull and Bear Lines
Clear visual representation of buy/sell signals
Identification of bullish turnarounds
Detection of golden crosses
Advanced operation line-based signals
HOW TO USE
Add the script to your TradingView chart.
Adjust input variables in the settings panel:
Heaven Line Period
Trading Line Period
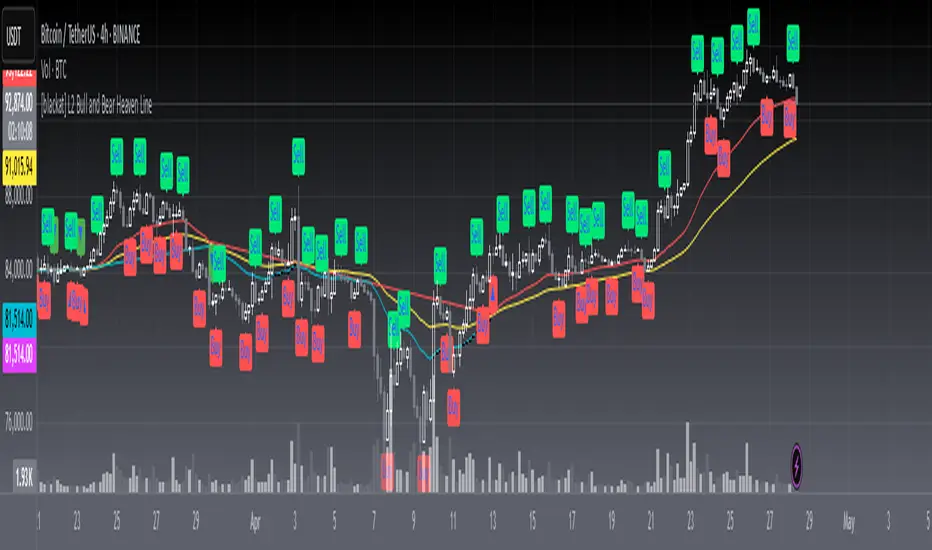
Observe the generated lines and signals on your chart:
Yellow Heaven Line
Red Bull Line
Aqua Bear Line
Buy/Sell signals marked with ▲ and ▼ icons
Bullish turnarounds highlighted in fuchsia
Golden cross events
LIMITATIONS
Reliance on moving average crossovers for signal generation
May produce false signals in choppy or ranging markets
Requires careful tuning of input parameters for optimal performance
NOTES
The script uses both simple and exponential moving averages
Custom calculations are employed for identifying turnarounds and operation line-based signals
Alert conditions are set up for various signal types
THANKS
Special thanks to the TradingView community for their valuable feedback and contributions to this indicator's development.
開源腳本
秉持TradingView一貫精神,這個腳本的創作者將其設為開源,以便交易者檢視並驗證其功能。向作者致敬!您可以免費使用此腳本,但請注意,重新發佈代碼需遵守我們的社群規範。
Avoid losing contact!Don't miss out! The first and most important thing to do is to join my Discord chat now! Click here to start your adventure: discord.com/invite/ZTGpQJq 防止失联,请立即行动,加入本猫聊天群: discord.com/invite/ZTGpQJq
免責聲明
這些資訊和出版物並非旨在提供,也不構成TradingView提供或認可的任何形式的財務、投資、交易或其他類型的建議或推薦。請閱讀使用條款以了解更多資訊。