INVITE-ONLY SCRIPT
已更新 Swing Rapat Jik ( LOW-HIGH ) Smart Money TrendBand
SWING RAPAT JIK ( LOW-HIGH ) Smart Money TrendBand
( 2023 updated edition )
The Swing Rapat Jik indicator is a method of knowing whether the current market is either at the highest or the lowest price.
It is also a relatively less risky strategy and suitable for long-term traders such as swing traders.
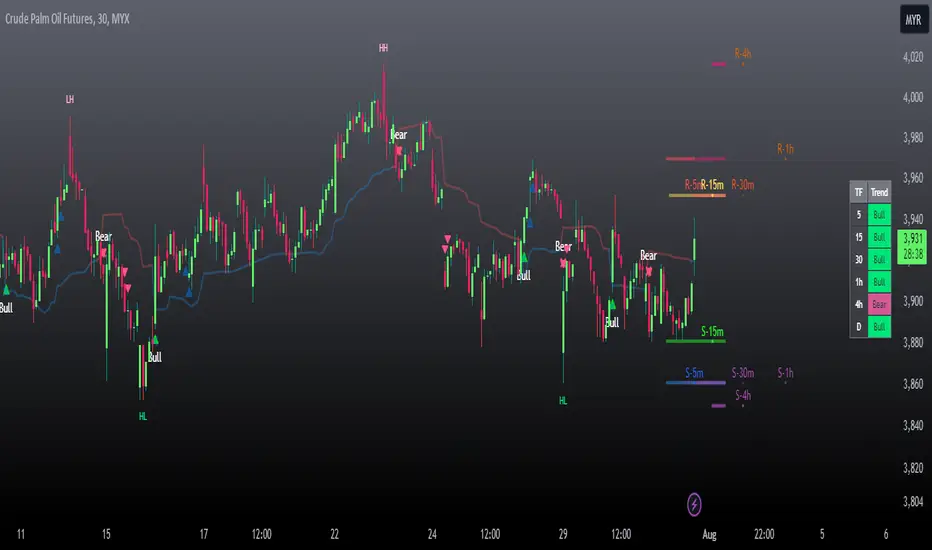
The analysis tool used is based on the Relative Strength Index ( RSI ) indicator as a parameter to measure the lowest price and the highest price in each cycle. If the price is at the extremely oversold level, then it shows the lowest price signal (LL/HL). Vice versa, if the price is at the extreme overbought level, then the signal will show the highest price signal (HH/LH).
It should be noted that this indicator is a repaint where it will make a re-mark if the price is at the lowest level of the previous signal. So, the solution is that I’ve added the Moving Average parameter as confirmation of the reversal of the LL price to the uptrend. That means the signal to enter the market only occurs when there is an Entry Price (EP) signal after LL/HL signal appears.
Please, do not enter the market when the EP signal is released if the LL/HL signal is not yet released. Make sure these two signals come out consecutively, starting with HL/LL and then the EP signal.
Key Signal;
LL = LOWER LOW
HL = HIGHER LOW
HH = HIGHER HIGH/TAKE PROFIT
LH = LOWER HIGH/TAKE PROFIT
EP = ENTRY PRICE
Hopefully, it can help traders to track the price at the lowest level before making a reversal and the highest price during the market supply situation.
*So far, the invention of the entry market is for the stock market only, which is to use buy signals only. Any updates for other markets will be notified from time to time.
Major updates;
1. Update version to Version 5 pine script
2. variable value used for the EP signal, to obtain a more significant weighted value.
3. Change of label color
4. Colored bars- bullish and bearish trends detected
SOPs and strategies

colored bars are pointers of the current trend and the period in which it occurred.

Use this combination as a strong confirmation

( 2023 updated edition )
The Swing Rapat Jik indicator is a method of knowing whether the current market is either at the highest or the lowest price.
It is also a relatively less risky strategy and suitable for long-term traders such as swing traders.
The analysis tool used is based on the Relative Strength Index ( RSI ) indicator as a parameter to measure the lowest price and the highest price in each cycle. If the price is at the extremely oversold level, then it shows the lowest price signal (LL/HL). Vice versa, if the price is at the extreme overbought level, then the signal will show the highest price signal (HH/LH).
It should be noted that this indicator is a repaint where it will make a re-mark if the price is at the lowest level of the previous signal. So, the solution is that I’ve added the Moving Average parameter as confirmation of the reversal of the LL price to the uptrend. That means the signal to enter the market only occurs when there is an Entry Price (EP) signal after LL/HL signal appears.
Please, do not enter the market when the EP signal is released if the LL/HL signal is not yet released. Make sure these two signals come out consecutively, starting with HL/LL and then the EP signal.
Key Signal;
LL = LOWER LOW
HL = HIGHER LOW
HH = HIGHER HIGH/TAKE PROFIT
LH = LOWER HIGH/TAKE PROFIT
EP = ENTRY PRICE
Hopefully, it can help traders to track the price at the lowest level before making a reversal and the highest price during the market supply situation.
*So far, the invention of the entry market is for the stock market only, which is to use buy signals only. Any updates for other markets will be notified from time to time.
Major updates;
1. Update version to Version 5 pine script
2. variable value used for the EP signal, to obtain a more significant weighted value.
3. Change of label color
4. Colored bars- bullish and bearish trends detected
SOPs and strategies
colored bars are pointers of the current trend and the period in which it occurred.
Use this combination as a strong confirmation
發行說明
Major updates,Added Multi-timeframe trends table & support resistance (SNR)
How it’s displayed
發行說明
1. set-up the trend table to fit on mobile apps screen2. re-organized the plot and shape for defaults setting
發行說明
set-up style color for customize發行說明
fix error on 30m trend僅限邀請腳本
僅作者批准的使用者才能訪問此腳本。您需要申請並獲得使用許可,通常需在付款後才能取得。更多詳情,請依照作者以下的指示操作,或直接聯絡TraderAsist。
TradingView不建議在未完全信任作者並了解其運作方式的情況下購買或使用腳本。您也可以在我們的社群腳本中找到免費的開源替代方案。
作者的說明
This script is for invitation only, please contact the admin for more information.
免責聲明
這些資訊和出版物並非旨在提供,也不構成TradingView提供或認可的任何形式的財務、投資、交易或其他類型的建議或推薦。請閱讀使用條款以了解更多資訊。
僅限邀請腳本
僅作者批准的使用者才能訪問此腳本。您需要申請並獲得使用許可,通常需在付款後才能取得。更多詳情,請依照作者以下的指示操作,或直接聯絡TraderAsist。
TradingView不建議在未完全信任作者並了解其運作方式的情況下購買或使用腳本。您也可以在我們的社群腳本中找到免費的開源替代方案。
作者的說明
This script is for invitation only, please contact the admin for more information.
免責聲明
這些資訊和出版物並非旨在提供,也不構成TradingView提供或認可的任何形式的財務、投資、交易或其他類型的建議或推薦。請閱讀使用條款以了解更多資訊。