OPEN-SOURCE SCRIPT
[PDR] Daily Rebalance
█ OVERVIEW
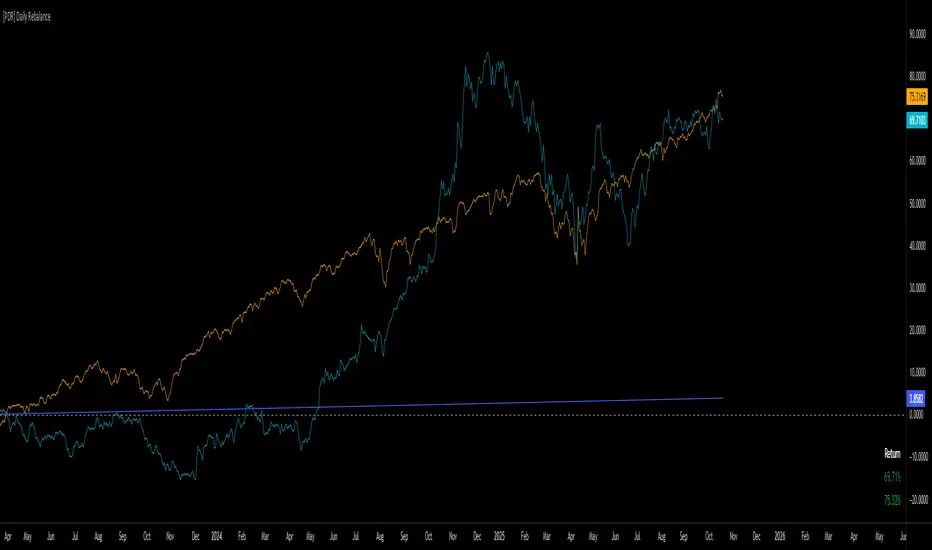
This indicator is a powerful portfolio backtesting tool designed to simulate the performance of a static-weight, daily rebalancing strategy. It allows you to define a portfolio of up to 10 assets, set their target weights, and track its cumulative return against a user-defined benchmark and a risk-free rate.
The core of the script is its daily rebalancing logic, which calculates and logs every trade needed to bring the portfolio back to its target allocations at the close of each day. This provides a transparent and detailed view of how a static portfolio would have performed historically, including the impact of trading costs.
█ KEY FEATURES
█ HOW TO USE
█ DISCLAIMER
This is a backtesting and simulation tool, not a trading signal generator. Its purpose is for research and performance analysis. Past performance is not indicative of future results. Always conduct your own research before making any investment decisions.
This indicator is a powerful portfolio backtesting tool designed to simulate the performance of a static-weight, daily rebalancing strategy. It allows you to define a portfolio of up to 10 assets, set their target weights, and track its cumulative return against a user-defined benchmark and a risk-free rate.
The core of the script is its daily rebalancing logic, which calculates and logs every trade needed to bring the portfolio back to its target allocations at the close of each day. This provides a transparent and detailed view of how a static portfolio would have performed historically, including the impact of trading costs.
█ KEY FEATURES
- Daily Rebalancing: Simulates a portfolio that is rebalanced at the close of every day to maintain target asset allocations.
- Customizable Portfolio: Configure up to 10 different assets with specific weights. If all weights are left at 0, the script automatically creates an equal-weight portfolio from the selected assets.
- Performance Comparison: Plots the portfolio's equity curve against a user-defined benchmark (e.g.,
 SET50) and a risk-free return, allowing for easy relative performance analysis.
 - Realistic Simulation: Accounts for trading costs like broker commission and minimum lot sizes for more accurate and grounded backtesting results.
- Detailed Performance Metrics: An on-chart table displays real-time statistics, including Current Drawdown, Max Drawdown, and Total Return for both your portfolio and the benchmark.
- Trade-by-Trade Logs: For full transparency, every rebalancing trade (BUY/SELL), including shares, price, notional value, and fees, is logged in the Pine Logs panel.
█ HOW TO USE
- **Apply to a Daily Chart:** This script is designed to work exclusively on the daily (1D) timeframe. Applying it to any other timeframe will result in a runtime error.
- **Configure Settings:** Open the indicator's settings. Set your `Initial Capital`, `Start Time`, and the `Benchmark` symbol you wish to compare against.
- **Define Your Assets:** In the 'Assets' group, check the box to enable each asset you want to include, select the symbol, and define its target `Weight (%)`.
- **Set Trading Costs:** Adjust the `Broker Commission (%)` and `Minimal Buyable Lot` to match your expected trading conditions.
- **Analyze the Results:** The performance curves are plotted in the indicator pane below your main chart. The key metrics table is displayed on the bottom-right of your chart.
- **View Rebalancing Trades:** This is a crucial step for understanding the simulation. To see the detailed daily trades, you **must** open the **Pine Logs**. You can find this panel at the bottom of your TradingView window, next to the "Pine Editor" and "Strategy Tester" tabs. The logs provide a complete breakdown of every rebalancing action.
█ DISCLAIMER
This is a backtesting and simulation tool, not a trading signal generator. Its purpose is for research and performance analysis. Past performance is not indicative of future results. Always conduct your own research before making any investment decisions.
開源腳本
秉持TradingView一貫精神,這個腳本的創作者將其設為開源,以便交易者檢視並驗證其功能。向作者致敬!您可以免費使用此腳本,但請注意,重新發佈代碼需遵守我們的社群規範。
mastertop
免責聲明
這些資訊和出版物並非旨在提供,也不構成TradingView提供或認可的任何形式的財務、投資、交易或其他類型的建議或推薦。請閱讀使用條款以了解更多資訊。
開源腳本
秉持TradingView一貫精神,這個腳本的創作者將其設為開源,以便交易者檢視並驗證其功能。向作者致敬!您可以免費使用此腳本,但請注意,重新發佈代碼需遵守我們的社群規範。
mastertop
免責聲明
這些資訊和出版物並非旨在提供,也不構成TradingView提供或認可的任何形式的財務、投資、交易或其他類型的建議或推薦。請閱讀使用條款以了解更多資訊。