OPEN-SOURCE SCRIPT
已更新 EPS+Sales+Net Profit+MCap+Sector & Industry

📄 Full Description
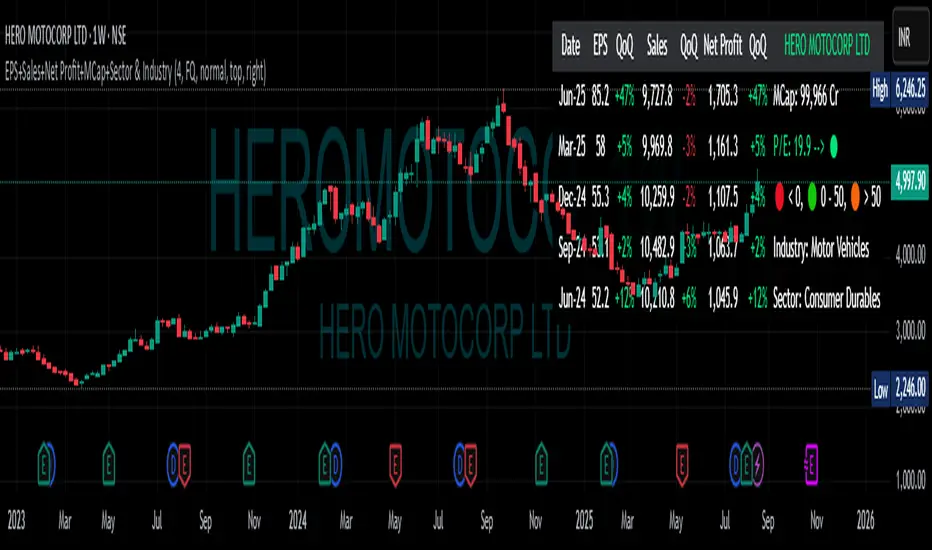
This script displays a comprehensive financial data panel directly on your TradingView chart, helping long-term investors and swing traders make informed decisions based on fundamental trends. It consolidates key financial metrics and business classification data into a single, visually clear table.
🔍 Key Features:
🧾 Financial Metrics (Auto-Fetched via request.financial):
EPS (Earnings Per Share) – Displayed with trend direction (QoQ or YoY).
Sales / Revenue – In ₹ Crores (for Indian stocks), trend change also included.
Net Profit – Also in ₹ Crores, along with percentage change.
Market Cap – Automatically calculated using outstanding shares × price, shown in ₹ Cr.
Free Float Market Cap – Based on float shares × price, also in ₹ Cr.
🏷️ Sector & Industry Info:
Automatically identifies and displays the Sector and Industry of the stock using syminfo.sector and syminfo.industry.
Displayed inline with metrics, making it easy to know what business the stock belongs to.
📊 Table View:
Compact and responsive table shown on your chart.
Columns: Date | EPS | QoQ | Sales | QoQ | Net Profit | QoQ | Metrics
Metrics column dynamically shows:
Market Cap
Free Float
Sector (Row 4)
Industry (Row 5)
🌗 Appearance:
Supports Dark Mode and Mini Mode toggle.
You can also customize:
Number of data points (last 4+ quarters or years)
Table position and size
🎯 Use Case:
This script is ideal for:
Fundamental-focused traders who use EPS/Sales trends to identify momentum.
Swing traders who combine price action with fundamental tailwinds.
Portfolio builders who want to see sector/industry alignment quickly.
It works best with fundamentally sound stocks where earnings and profitability are a major factor in price movements.
✅ Important Notes:
Script uses request.financial which only works with supported symbols (mostly stocks).
Market Cap and Free Float are calculated in ₹ Crores.
All financial values are rounded and formatted for readability (e.g., 1,234 Cr).
🙏 Credits:
Developed and published by Sameer Thorappa
Built with a clean, minimalist approach for high readability and functionality.
發行說明
Update – Added P/E Ratio to the Table 📊In this update, I’ve introduced the Price-to-Earnings (P/E) ratio directly into the indicator’s table for quicker and more informed decision-making.
Now, along with the existing fundamental details, you can instantly see the stock’s valuation metric without having to
leave your chart.
This helps you:
🔶 Quickly assess valuation at a glance.
🔶 Compare stocks in the same sector or industry.
🔶 Spot potential opportunities when P/E is unusually high or low.
This makes the indicator even more powerful for traders who blend technical analysis with fundamentals.
發行說明
Version 2.1 – Corrected PE Wording to P/E✅ In this update, I refined the table’s label for clarity — the metric previously shown as “PE” is now displayed as “P/E” (Price-to-Earnings), following standard financial notation. This makes the table more accurate and professional.
發行說明
📊 Cleaner Look, Smarter Insights!🚀 New Update Released – your favorite indicator just got even better:
✨ What’s New
✅Company names now displayed directly in the table
✅Customize header, table, and text colors to match your chart
✅Smarter P/E conditional formatting for instant clarity:
🔴 Negative P/E
🟢 Healthy (0–50)
🟠 High (>50)
✅Upgraded to Pine Script v6 for better performance & future-ready support
🗑️ What’s Removed
❎Dark theme option
❎Mini mode
發行說明
- Minor correction in Smarter P/E conditional formatting for instant clarity🔴 Negative P/E
🟢 Healthy (0–50)
🟠 High (>50)
開源腳本
秉持TradingView一貫精神,這個腳本的創作者將其設為開源,以便交易者檢視並驗證其功能。向作者致敬!您可以免費使用此腳本,但請注意,重新發佈代碼需遵守我們的社群規範。
Sameer Thorappa
Network Engineer transitioning into the world of investing. Passionate about swing trading, price action, and technical & fundamental analysis.
Network Engineer transitioning into the world of investing. Passionate about swing trading, price action, and technical & fundamental analysis.
免責聲明
這些資訊和出版物並非旨在提供,也不構成TradingView提供或認可的任何形式的財務、投資、交易或其他類型的建議或推薦。請閱讀使用條款以了解更多資訊。