OPEN-SOURCE SCRIPT
HTF 6H Visualiser for 30M - ADK - W
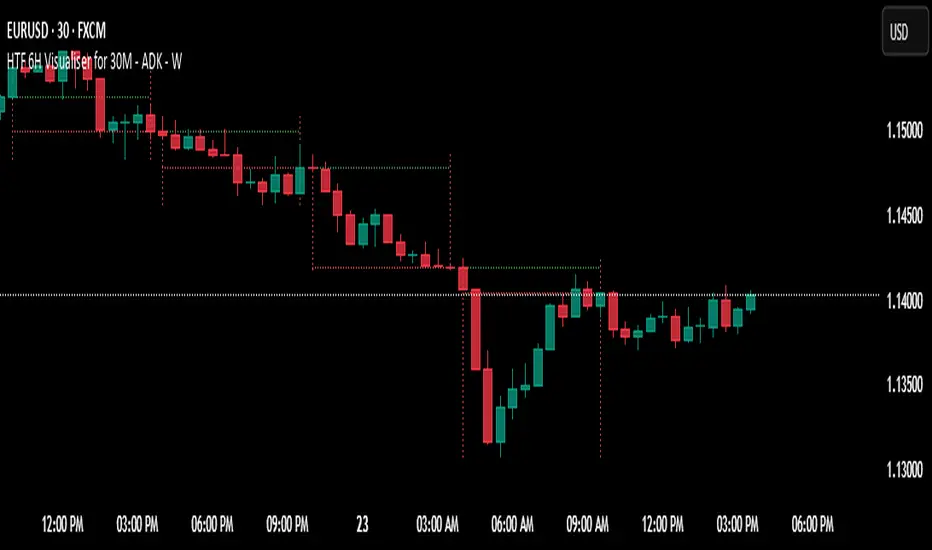
HTF 6H Visualiser — use on 30-minute charts
Purpose – lets 30-minute traders see the prior 6-hour candle’s range, open and close without changing time-frames.
Visual elements
Two dotted vertical lines mark the 6-hour candle’s start and an “early” finish one 30-min bar before the true close (avoids overlap).
Vertical colour: green for bullish 6 H close, red for bearish.
Dotted green horizontal at the 6 H open, red horizontal at the 6 H close – both drawn only between the two verticals.
Verticals are clipped to that candle’s exact high and low.
Data window – auto-deletes oldest guides so only ~2 trading days (8 candles) remain on the chart.
Typical uses – mean-reversion to 6 H opens/closes, quick HTF bias check, liquidity-grab targets.
開源腳本
秉持TradingView一貫精神,這個腳本的創作者將其設為開源,以便交易者檢視並驗證其功能。向作者致敬!您可以免費使用此腳本,但請注意,重新發佈代碼需遵守我們的社群規範。
免責聲明
這些資訊和出版物並非旨在提供,也不構成TradingView提供或認可的任何形式的財務、投資、交易或其他類型的建議或推薦。請閱讀使用條款以了解更多資訊。
開源腳本
秉持TradingView一貫精神,這個腳本的創作者將其設為開源,以便交易者檢視並驗證其功能。向作者致敬!您可以免費使用此腳本,但請注意,重新發佈代碼需遵守我們的社群規範。
免責聲明
這些資訊和出版物並非旨在提供,也不構成TradingView提供或認可的任何形式的財務、投資、交易或其他類型的建議或推薦。請閱讀使用條款以了解更多資訊。