PROTECTED SOURCE SCRIPT
EMA 9 & 21 Crossover D-Line
📈 9 & 21 EMA Crossover – Trend Trading Made Simple
Description:
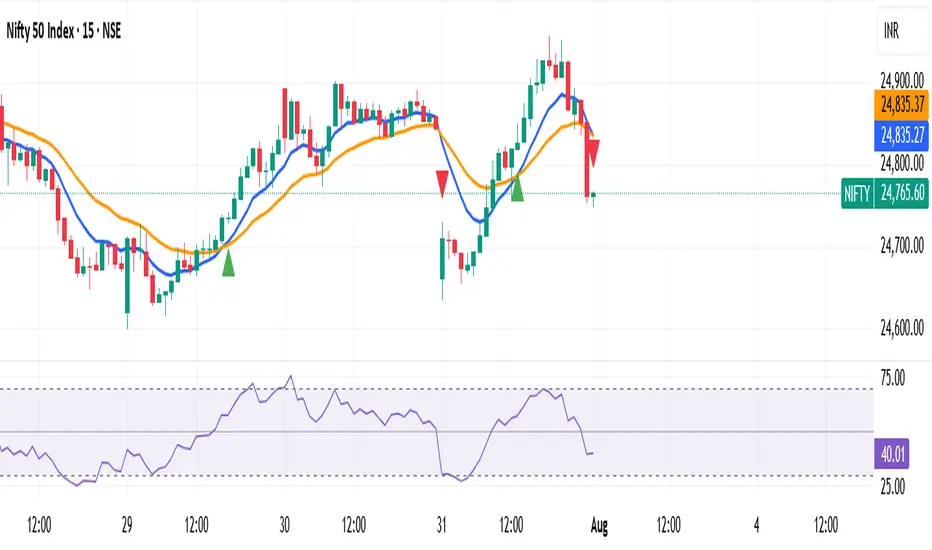
The 9 & 21 EMA Crossover indicator is a simple yet powerful trend-following tool designed for traders of all levels. This script plots two widely used exponential moving averages — a fast 9 EMA and a slower 21 EMA — directly on your chart.
When the 9 EMA crosses above the 21 EMA, it signals a potential bullish trend — perfect for spotting early entries in uptrends. Conversely, when the 9 EMA crosses below the 21 EMA, it indicates a possible bearish trend — ideal for identifying exit points or short opportunities.
Key Features:
✅ Clean and clear crossover signals marked with triangles
✅ Customizable visual settings for easy trend spotting
✅ Works on all timeframes and markets (stocks, forex, crypto, commodities)
✅ Suitable for intraday, swing, and position trading
This classic EMA crossover strategy is a favorite among trend traders for its simplicity and reliability. Combine it with your own confirmation tools or price action setups for even stronger results.
How to Use:
Look for a bullish crossover for potential buy setups.
Look for a bearish crossover for potential sell setups.
Use in conjunction with other technical tools for best results.
Disclaimer: This indicator is for educational purposes only. Always do your own research and practice good risk management before live trading.
Happy Trading! 📊✨
Description:
The 9 & 21 EMA Crossover indicator is a simple yet powerful trend-following tool designed for traders of all levels. This script plots two widely used exponential moving averages — a fast 9 EMA and a slower 21 EMA — directly on your chart.
When the 9 EMA crosses above the 21 EMA, it signals a potential bullish trend — perfect for spotting early entries in uptrends. Conversely, when the 9 EMA crosses below the 21 EMA, it indicates a possible bearish trend — ideal for identifying exit points or short opportunities.
Key Features:
✅ Clean and clear crossover signals marked with triangles
✅ Customizable visual settings for easy trend spotting
✅ Works on all timeframes and markets (stocks, forex, crypto, commodities)
✅ Suitable for intraday, swing, and position trading
This classic EMA crossover strategy is a favorite among trend traders for its simplicity and reliability. Combine it with your own confirmation tools or price action setups for even stronger results.
How to Use:
Look for a bullish crossover for potential buy setups.
Look for a bearish crossover for potential sell setups.
Use in conjunction with other technical tools for best results.
Disclaimer: This indicator is for educational purposes only. Always do your own research and practice good risk management before live trading.
Happy Trading! 📊✨
受保護腳本
此腳本以閉源形式發佈。 不過,您可以自由且不受任何限制地使用它 — 在此處了解更多資訊。
免責聲明
這些資訊和出版物並不意味著也不構成TradingView提供或認可的金融、投資、交易或其他類型的意見或建議。請在使用條款閱讀更多資訊。
受保護腳本
此腳本以閉源形式發佈。 不過,您可以自由且不受任何限制地使用它 — 在此處了解更多資訊。
免責聲明
這些資訊和出版物並不意味著也不構成TradingView提供或認可的金融、投資、交易或其他類型的意見或建議。請在使用條款閱讀更多資訊。