INVITE-ONLY SCRIPT
已更新 TTrades Scalping Indicator [TFO]
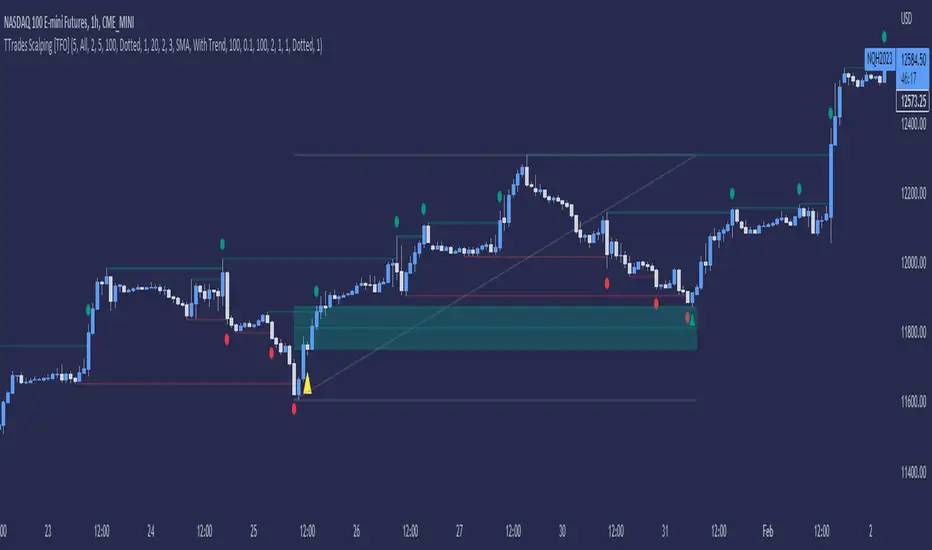
Specialized for the scalping strategy of TTrades, this indicator focuses on inducement / stop hunt setups, utilizing additional factors such as volume spikes and trend bias to filter out setups that don’t fit the user-defined criteria.
The idea is that price is always seeking liquidity by reaching for trivial pivots where traders may put their stop loss orders. When price seeks these levels and stops these traders out, we may observe an influx of volume due to the large number of shares/contracts being exchanged given the large number of traders that have similar orders.

If price quickly comes back into the original range, we may determine this to be a stop hunt or a fakeout, only for price to proceed in the opposing direction. If it continues running and creates a displacement leg, we look to capitalize on that movement by tracking the Optimal Trade Entry (62 - 79% retracement), anchored to the swing pivot created as a result of the stop hunt.
Aside from volume, we can also use existing technical indicators like VWAP and SMA’s to ensure we’re only taking trades with the current trend (or against it). Simple criteria like this can help keep us out of low probability market environments.

The idea is that price is always seeking liquidity by reaching for trivial pivots where traders may put their stop loss orders. When price seeks these levels and stops these traders out, we may observe an influx of volume due to the large number of shares/contracts being exchanged given the large number of traders that have similar orders.
If price quickly comes back into the original range, we may determine this to be a stop hunt or a fakeout, only for price to proceed in the opposing direction. If it continues running and creates a displacement leg, we look to capitalize on that movement by tracking the Optimal Trade Entry (62 - 79% retracement), anchored to the swing pivot created as a result of the stop hunt.
Aside from volume, we can also use existing technical indicators like VWAP and SMA’s to ensure we’re only taking trades with the current trend (or against it). Simple criteria like this can help keep us out of low probability market environments.
發行說明
v1.1- Added an optional alert session to only have user alerts fire during a certain window of time
- Updated instructions to access private indicators
發行說明
- Updated signup link. No version change required發行說明
v1.2- Added an aggression parameter to measure how swiftly price comes back into the original range after taking a level of interest
發行說明
Updates to Author's Instructions for access. No version change發行說明
v2.0.0This reversion overhauls the TTrades Scalping Indicator with Optimization features that vastly simplify the process of finding settings for a given symbol/timeframe. Several dozen simulations are conducted on historical data to evaluate various performance outcomes and extract optimal input values.
Using the core settings of this indicator, we vary the inputs by some "step value" to assess performance under slightly different conditions. The Optimization Table shows users simulated performance results in order to quickly identify advantageous input values. Users can choose to grade these performance results by raw profit, win rate, profit factor, etc. Optimal Settings are then extracted from the Optimization Table and shown separately to identify the "best" settings from the available dataset.
A Simulated Equity Curve can also be plotted to track the simulated historical performance of the current settings on a trade by trade basis. Several strategy parameters are included to provide options for how simulated entries and exits are managed.
發行說明
v2.1.0- Added a "Fixed" option for simulated trade stop loss and profit target, within the new Optimization features
- Improved Inducement and OTE logic (more representative of v1 behavior)
- Bug fixes
發行說明
v2.2.0- Added Timeframe Continuity as an optional factor of confluence
發行說明
v.2.2.1- Fixed the behavior of simulated trades with very small profit target/stop loss values in low resolution charts
- The colors of simulated trade labels are now adaptive to the user's chart colors
發行說明
v2.2.2- Exporting instances of Inducement for use in external indicators
僅限邀請腳本
只有經作者批准的使用者才能訪問此腳本。您需要申請並獲得使用權限。該權限通常在付款後授予。如欲了解更多詳情,請依照以下作者的說明操作,或直接聯絡tradeforopp。
除非您完全信任其作者並了解腳本的工作原理,否則TradingView不建議您付費或使用腳本。您也可以在我們的社群腳本中找到免費的開源替代方案。
作者的說明
Get access here: https://stratalerts.com/tfo/
提醒:在請求訪問權限之前,請閱讀僅限邀請腳本指南。
免責聲明
這些資訊和出版物並不意味著也不構成TradingView提供或認可的金融、投資、交易或其他類型的意見或建議。請在使用條款閱讀更多資訊。