OPEN-SOURCE SCRIPT
Williams Alligator Trend Filter Heatmap
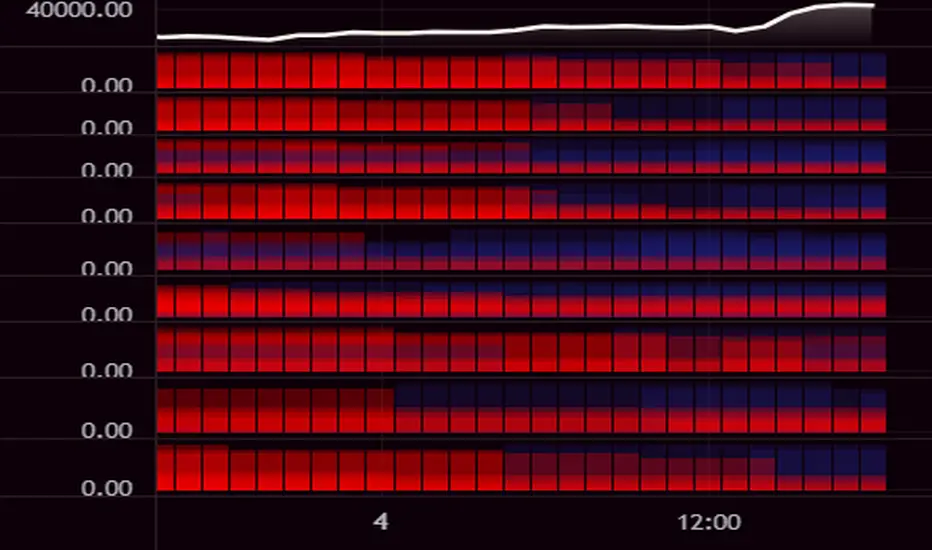
Hello I've decided that the alligator lines can be used to find a trend. This script expands on that and checks 10 different multipliers to see trend over the long term and have 10 values. Those 10 values each give a color to one of the 10 lines in turn giving this Fire like plotting. I personaly use this to see if there is fear (red) in the markets or greed (blue), plotted 9 different crypto coins on the chart and have 4 columns in my setup to see the values on different timeframes. In the chart preview this is 1H,30M,10M,1M to see current environment. The colors use alot of data to generate especialy the bottom part, that colors based on a very long time zone.
開源腳本
秉持TradingView一貫精神,這個腳本的創作者將其設為開源,以便交易者檢視並驗證其功能。向作者致敬!您可以免費使用此腳本,但請注意,重新發佈代碼需遵守我們的社群規範。
✅ Let me help you become profitable long-term.
Patreon -> patreon.com/ChartMuse
Patreon -> patreon.com/ChartMuse
✅ Work with me:
Form -> forms.gle/caAJxCNTP4CqjFy4A
Form -> forms.gle/caAJxCNTP4CqjFy4A
Patreon -> patreon.com/ChartMuse
Patreon -> patreon.com/ChartMuse
✅ Work with me:
Form -> forms.gle/caAJxCNTP4CqjFy4A
Form -> forms.gle/caAJxCNTP4CqjFy4A
免責聲明
這些資訊和出版物並非旨在提供,也不構成TradingView提供或認可的任何形式的財務、投資、交易或其他類型的建議或推薦。請閱讀使用條款以了解更多資訊。