OPEN-SOURCE SCRIPT
已更新 Pivot Levels [UkutaLabs]
█ OVERVIEW
The Pivot Levels Indicator provides real-time insight into key price levels within the market that can serve as powerful support and resistance levels. These levels are based on currently-relevant price-action information to ensure that the lines being drawn provide the most value to traders regardless of their trading style.
The aim of this script is to simplify the trading experience of users by automatically identifying and displaying price levels that they should be aware of.
█ USAGE
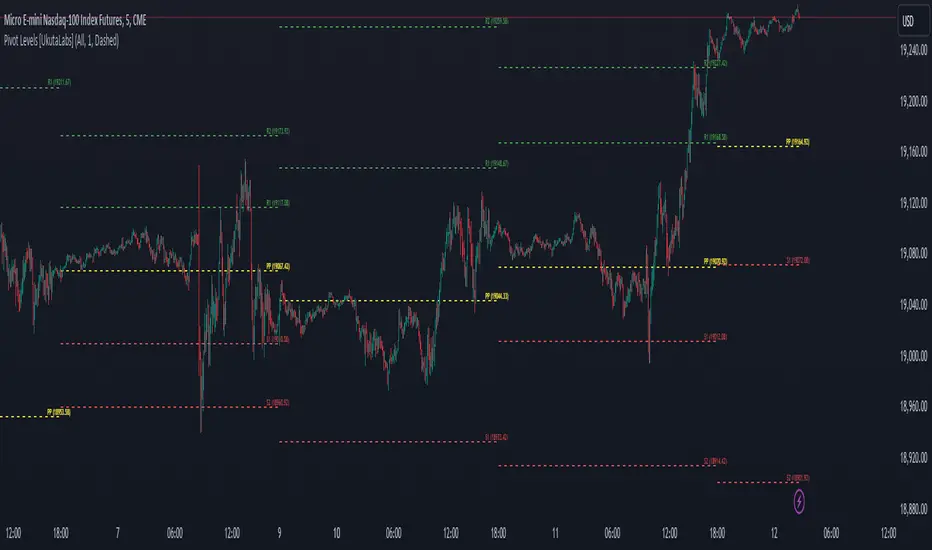
At the beginning of each trading day, the script will identify the previous day’s hlc3 level. We refer to this level as the day’s Source Level, and it is from this price that the other Resistance and Support levels are calculated.
The script then identifies the total price range of the previous day (Previous Day High - Previous Day Low), then draws Resistance and Support lines based on the Source Level and the previous day’s range.
The script identifies these levels on both sides of the Source. Levels above the Source are considered to be points of Resistance and below the Source are considered to be Support, but the levels are free to be interpreted and used in whatever way fits the user’s trading strategy.
A label is drawn at the end of each line that identifies the line and whether it represents support or resistance. These labels can be disabled in the settings.
█ SETTINGS
Configuration
• Show Labels: Determines whether or not labels are displayed at the end of each line.
• Display Mode: Determines the number of days for the script to load.
Line Settings
• Resistance Color: Determines the color of the resistance lines and labels above the Source Level.
• Source Color: Determines the color of the source line and label.
• Support Color: Determines the color of the support lines and labels below the Source Level.
• Line width: Determines the width of lines.
• Line Style: Determines the style of lines.
The Pivot Levels Indicator provides real-time insight into key price levels within the market that can serve as powerful support and resistance levels. These levels are based on currently-relevant price-action information to ensure that the lines being drawn provide the most value to traders regardless of their trading style.
The aim of this script is to simplify the trading experience of users by automatically identifying and displaying price levels that they should be aware of.
█ USAGE
At the beginning of each trading day, the script will identify the previous day’s hlc3 level. We refer to this level as the day’s Source Level, and it is from this price that the other Resistance and Support levels are calculated.
The script then identifies the total price range of the previous day (Previous Day High - Previous Day Low), then draws Resistance and Support lines based on the Source Level and the previous day’s range.
The script identifies these levels on both sides of the Source. Levels above the Source are considered to be points of Resistance and below the Source are considered to be Support, but the levels are free to be interpreted and used in whatever way fits the user’s trading strategy.
A label is drawn at the end of each line that identifies the line and whether it represents support or resistance. These labels can be disabled in the settings.
█ SETTINGS
Configuration
• Show Labels: Determines whether or not labels are displayed at the end of each line.
• Display Mode: Determines the number of days for the script to load.
Line Settings
• Resistance Color: Determines the color of the resistance lines and labels above the Source Level.
• Source Color: Determines the color of the source line and label.
• Support Color: Determines the color of the support lines and labels below the Source Level.
• Line width: Determines the width of lines.
• Line Style: Determines the style of lines.
發行說明
• Added a new setting: Timeframe. This setting gives users the ability to choose whether Pivot Levels will be drawn based on the daily, weekly or monthly timeframe.• Added a new setting: Font Size. This settings gives users the ability to change the font size of labels, improving the user experience on mobile devices.
發行說明
- Changed default load period to one day.- Added ability to change alignment of labels.
開源腳本
秉持TradingView一貫精神,這個腳本的創作者將其設為開源,以便交易者檢視並驗證其功能。向作者致敬!您可以免費使用此腳本,但請注意,重新發佈代碼需遵守我們的社群規範。
免責聲明
這些資訊和出版物並非旨在提供,也不構成TradingView提供或認可的任何形式的財務、投資、交易或其他類型的建議或推薦。請閱讀使用條款以了解更多資訊。
免責聲明
這些資訊和出版物並非旨在提供,也不構成TradingView提供或認可的任何形式的財務、投資、交易或其他類型的建議或推薦。請閱讀使用條款以了解更多資訊。