PROTECTED SOURCE SCRIPT
TDS9 Counting (Red & Blue, Offset Labels)
Here’s a polished, **publication‑ready narrative** for your *TDS9 Counting (Red & Blue, Offset Labels)* indicator, written in the same style as the previous ones:
---
**TDS9 Counting (Red & Blue, Offset Labels)**
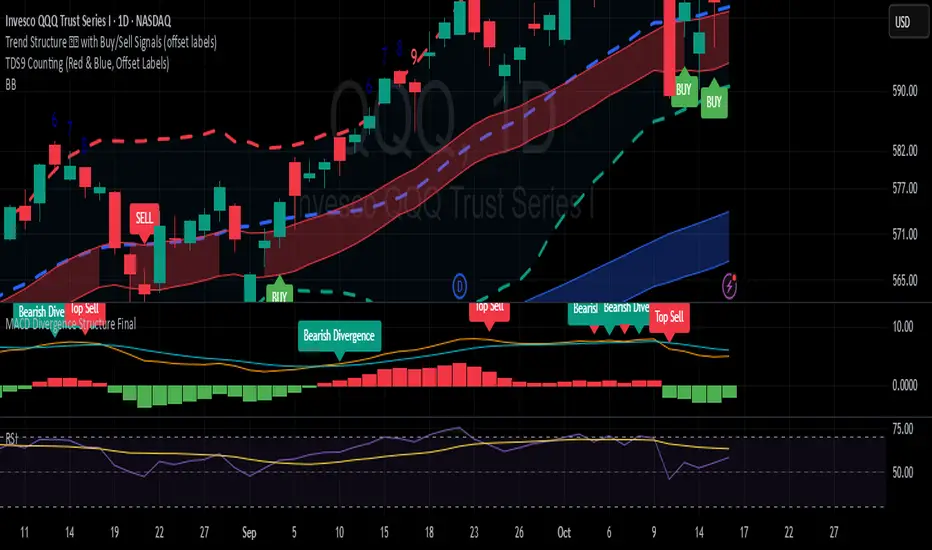
This indicator implements a sequential counting method to help traders identify potential exhaustion points in ongoing trends. It tracks sequences of price closes relative to the prior 4 bars, building up to a **9‑count structure** that often signals areas where momentum may be weakening and a reversal or pause could occur.
The script automatically labels counts **6 through 9** directly on the chart, with clear **color‑coded markers**:
- **Red numbers** for downward sequences (bearish setups)
- **Dark blue numbers** for upward sequences (bullish setups)
- A **red “9”** highlights a potential exhaustion point in an uptrend, while a **blue “9”** marks exhaustion in a downtrend
To maintain chart clarity, labels are **offset slightly above or below candles** using dynamic spacing, ensuring signals remain visible without overlapping price action. This makes it easy to track the progression of counts in real time while keeping the chart clean and readable.
By combining structured sequential logic with intuitive visual cues, this tool helps traders:
- Monitor developing **trend exhaustion patterns**
- Anticipate potential **reversal or consolidation zones**
- Add a **systematic layer of confirmation** to existing strategies
- Keep charts uncluttered with offset, color‑coded labels
Whether you’re a discretionary trader looking for exhaustion confirmation or a systematic trader layering signals into a broader strategy, this indicator provides a **clear, structured framework** for spotting potential turning points in price action.
---
**TDS9 Counting (Red & Blue, Offset Labels)**
This indicator implements a sequential counting method to help traders identify potential exhaustion points in ongoing trends. It tracks sequences of price closes relative to the prior 4 bars, building up to a **9‑count structure** that often signals areas where momentum may be weakening and a reversal or pause could occur.
The script automatically labels counts **6 through 9** directly on the chart, with clear **color‑coded markers**:
- **Red numbers** for downward sequences (bearish setups)
- **Dark blue numbers** for upward sequences (bullish setups)
- A **red “9”** highlights a potential exhaustion point in an uptrend, while a **blue “9”** marks exhaustion in a downtrend
To maintain chart clarity, labels are **offset slightly above or below candles** using dynamic spacing, ensuring signals remain visible without overlapping price action. This makes it easy to track the progression of counts in real time while keeping the chart clean and readable.
By combining structured sequential logic with intuitive visual cues, this tool helps traders:
- Monitor developing **trend exhaustion patterns**
- Anticipate potential **reversal or consolidation zones**
- Add a **systematic layer of confirmation** to existing strategies
- Keep charts uncluttered with offset, color‑coded labels
Whether you’re a discretionary trader looking for exhaustion confirmation or a systematic trader layering signals into a broader strategy, this indicator provides a **clear, structured framework** for spotting potential turning points in price action.
受保護腳本
此腳本以閉源形式發佈。 不過,您可以自由使用,沒有任何限制 — 點擊此處了解更多。
免責聲明
這些資訊和出版物並非旨在提供,也不構成TradingView提供或認可的任何形式的財務、投資、交易或其他類型的建議或推薦。請閱讀使用條款以了解更多資訊。
受保護腳本
此腳本以閉源形式發佈。 不過,您可以自由使用,沒有任何限制 — 點擊此處了解更多。
免責聲明
這些資訊和出版物並非旨在提供,也不構成TradingView提供或認可的任何形式的財務、投資、交易或其他類型的建議或推薦。請閱讀使用條款以了解更多資訊。