OPEN-SOURCE SCRIPT
已更新 Psychological Lines
**The Option Chain Shows Strike Price Levels per Index Option**
- **Bank Nifty Index:** 100-point difference or gap between two strike prices.
- **Nifty 50 Index:** 50-point difference or gap between two strike prices.
- **FinNifty 50 Index:** 50-point difference or gap between two strike prices.
**Importance of These Levels:**
- When prices trade at these levels, the option premium either increases or decreases.
- Round numbers always affect option prices.
- Psychological round numbers have a significant impact and act as support and resistance.
- More strangle or straddle positions are created at these levels.
- More call writers or put writers trade at these levels.
**Benefits of Plotting Levels on Charts:**
- Having levels to plot on the chart is always helpful while trading and aids in taking trade positions accordingly.
**Indicator Features:**
- Helps users with various functionalities.
- Allows users to plot lines as needed and adjust the gap between lines as per requirements or option strikes.
- User input to show the number of lines on the chart.
- Tooltip on each level, indicating the current price (LTP) and the difference in points from the LTP.
- Simple to use.
- User-friendly.
- Enhances trading experience with the help of lines.
---
These adjustments should make the text clearer and more professional. If you need any further changes, feel free to ask!
發行說明
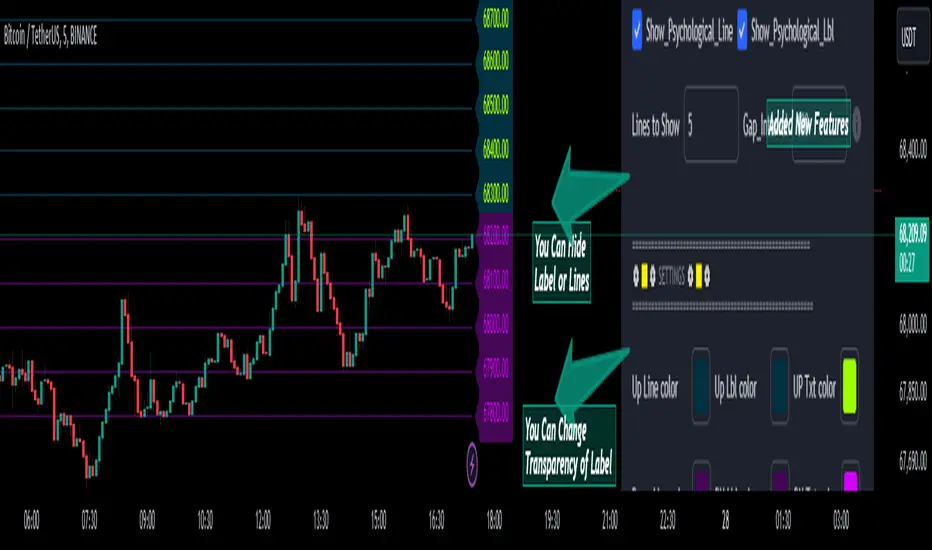
Now that the Script is Updated the overlapping of label & Line issue is solved.發行說明
Group & Settings Added ( Updated)發行說明
The improved script looks well-organized and feature-rich! Here are a few notable enhancements and additions in the code:
User Input for Customization: The script allows users to customize the number of lines, gap interval, line and label colors, transparency, and line width. This makes it highly adaptable to different charting needs.
Tooltips: You've added tooltips to the labels, which provide detailed information about the lines and their positions relative to the current close price. This is a great feature for better understanding and analysis.
Conditional Display: Lines and labels are drawn based on user input, ensuring that unnecessary elements are not plotted if not needed.
Color and Transparency: Customizable colors and transparency for labels enhance visual clarity and chart readability.
This updated version should provide a cleaner and more informative chart experience. If you have any specific questions or need further improvements, feel free to ask!
開源腳本
秉持TradingView一貫精神,這個腳本的創作者將其設為開源,以便交易者檢視並驗證其功能。向作者致敬!您可以免費使用此腳本,但請注意,重新發佈代碼需遵守我們的社群規範。
免責聲明
這些資訊和出版物並非旨在提供,也不構成TradingView提供或認可的任何形式的財務、投資、交易或其他類型的建議或推薦。請閱讀使用條款以了解更多資訊。
開源腳本
秉持TradingView一貫精神,這個腳本的創作者將其設為開源,以便交易者檢視並驗證其功能。向作者致敬!您可以免費使用此腳本,但請注意,重新發佈代碼需遵守我們的社群規範。
免責聲明
這些資訊和出版物並非旨在提供,也不構成TradingView提供或認可的任何形式的財務、投資、交易或其他類型的建議或推薦。請閱讀使用條款以了解更多資訊。