OPEN-SOURCE SCRIPT
已更新 Inverse Bands
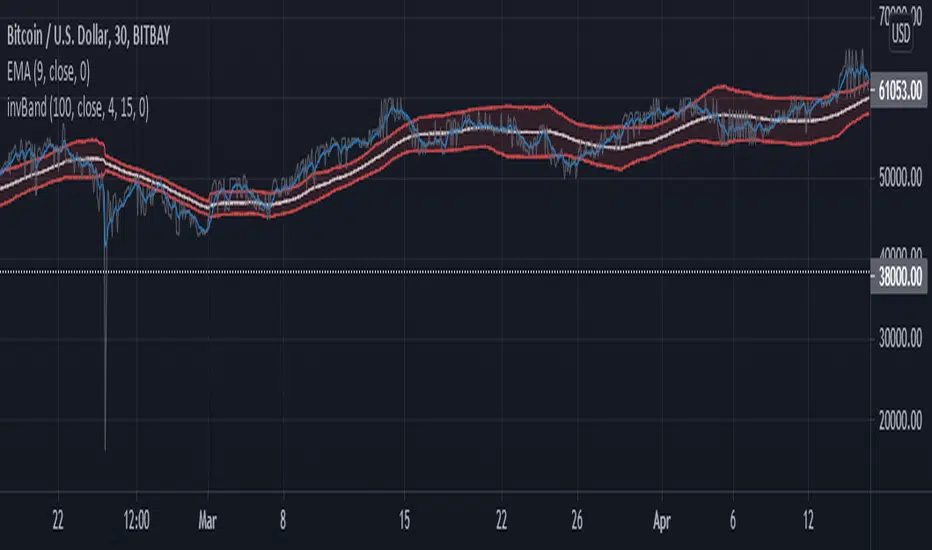
I'm very new to trading. I've been toying with moving averages to trigger swing trades and wanted an indicator that would swell when price moves sideways and squeeze when price is trending.
So this is the inverse of the popular Bollinger Bands indicator. It makes a very easy identifier for price breakout when paired with your favorite fast moving average. When MA falls outside the bands, it indicates an emerging trend. Still requires some curve fitting, but it is a work in progress.
I hope this isn't a direct copy of something I am not aware of.
發行說明
Worked out a reliable way to invert Bol Bands across a wider price range. Still needs some curve fitting via "Length" and "X Offset" settings. In future revisions ill try to automate the fitting based on current price maybe. Until then we will have to manually fit the settings.發行說明
Squared the percentage, not totally sure it helped. Did some fine tuning with settings, and changed the label of X offset to width, because that is essentially what it does.開源腳本
秉持TradingView一貫精神,這個腳本的創作者將其設為開源,以便交易者檢視並驗證其功能。向作者致敬!您可以免費使用此腳本,但請注意,重新發佈代碼需遵守我們的社群規範。
免責聲明
這些資訊和出版物並非旨在提供,也不構成TradingView提供或認可的任何形式的財務、投資、交易或其他類型的建議或推薦。請閱讀使用條款以了解更多資訊。
開源腳本
秉持TradingView一貫精神,這個腳本的創作者將其設為開源,以便交易者檢視並驗證其功能。向作者致敬!您可以免費使用此腳本,但請注意,重新發佈代碼需遵守我們的社群規範。
免責聲明
這些資訊和出版物並非旨在提供,也不構成TradingView提供或認可的任何形式的財務、投資、交易或其他類型的建議或推薦。請閱讀使用條款以了解更多資訊。