OPEN-SOURCE SCRIPT
已更新 TTP QFL Optimiser
This tool is designed to help finding the best take profit and stop loss levels when trading with QFL bases (Quick Fingers Luc).
You can use it to see the average drawdown among all historic bases broken for an asset and then find the drawdowns that are more frequent using the percentile parameters provided.
For example, by knowing that 98% of the bases got broken with a drawdown of up to 5% can become extremely useful for deciding where to place your take profit or stop loss levels.
It supports QFL 1H, 2H and 4H but make sure to set the chart timeframe to a lower timeframe than QFL to obtain valid results.
Two percentiles are provided to be able to evaluate potential TP and SL at the same time.
Steps:
- Load an asset in the 15min TF
- Select the QFL version: 1H more deals / lower quality vs 4H less deals/ better quality
- Find a percentile that triggers enough deals (example: 70) and then another percentile that doesn't get hit too much (example: 98)
- Confirm the values p1 and p2 provided in the table and the white and grey lines for the results of which drawdown percentages correspond to such selection of percentiles
Once having p1 and p2 use your backtesting and forward testing tools to confirm and adjust accordingly.
發行說明
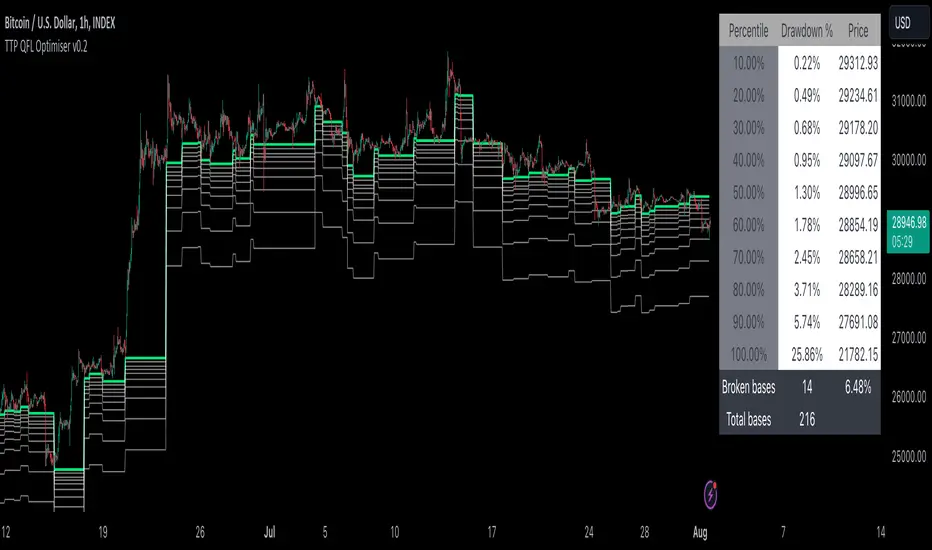
Added Percentile bands. It offers 10 percentiles, 10% groups.- What is the distribution of drawdowns from each version of QFL bases broken?
- What percentage of bases have been broken and price still doesn't manage to recover above the base?
You can work with the two supported modes:
- Percentile bands, divide all drawdowns from base broken in 10 percentiles 10%, 20%, 30%....100%. Bands are drawn and a table displayed with all gathered statistics
- Twin percentile, the user picks 2 custom percentiles and a table is shown with data
發行說明
small bug發行說明
bug fix開源腳本
秉持TradingView一貫精神,這個腳本的創作者將其設為開源,以便交易者檢視並驗證其功能。向作者致敬!您可以免費使用此腳本,但請注意,重新發佈代碼需遵守我們的社群規範。
Join our membership to gain access to the private scripts.
patreon.com/c/thetradingparrot
patreon.com/c/thetradingparrot
免責聲明
這些資訊和出版物並非旨在提供,也不構成TradingView提供或認可的任何形式的財務、投資、交易或其他類型的建議或推薦。請閱讀使用條款以了解更多資訊。
開源腳本
秉持TradingView一貫精神,這個腳本的創作者將其設為開源,以便交易者檢視並驗證其功能。向作者致敬!您可以免費使用此腳本,但請注意,重新發佈代碼需遵守我們的社群規範。
Join our membership to gain access to the private scripts.
patreon.com/c/thetradingparrot
patreon.com/c/thetradingparrot
免責聲明
這些資訊和出版物並非旨在提供,也不構成TradingView提供或認可的任何形式的財務、投資、交易或其他類型的建議或推薦。請閱讀使用條款以了解更多資訊。