INVITE-ONLY SCRIPT
已更新 Gregoire Channel Width
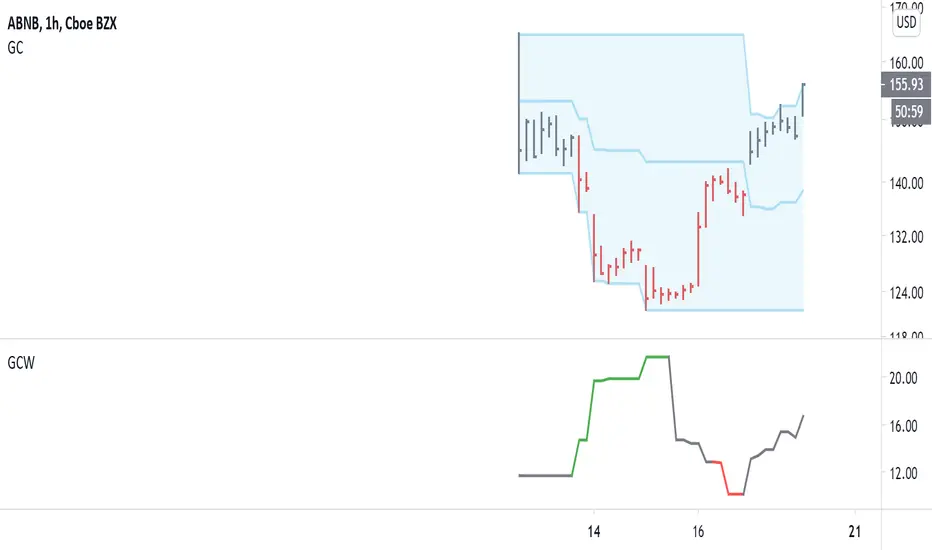
This indicator goes with the Gregoire Channel (not shown). It measures the distance from an edge to the middle of the channel.
This serves two purposes:
1) Volatility adjusted position sizing
2) Options buying/selling
-----------------
The formula for volatility adjusted position size is: (account value * risk) / (GC Width / Entry price).
For example, let's say we have a $15,000 account size and want to risk 2% on a TQQQ trade. The GC Width is $8.77 and entry is $167.59.
That gives us a position size of: (15,000 * 0.02) / (8.77 / 167.59) = $5,732.84. Our stop would be around the middle of the channel, in this case.
We use this so we avoid getting blown out in fast-moving markets, yet still make enough for slow moving markets. Too much risk destroys accounts!
-----------------
The green and red colors indicate areas to buy and sell options. RED = sell options, GREEN = buy options.
Options are priced according to volatility. We want to buy them when volatility is low, and sell them when volatility is high. These can also be used as take-profit areas: we buy options on the green and close for profit on the red areas, etc.
發行說明
Use the link below to get access to this indicator, plus the Gregoire Channel and Gregoire Channel Strategy!發行說明
Cleaned up the expansion/contraction color signals.發行說明
Provided support for brand new markets with no history.Changed color scheme: GREEN means expansion, RED means contraction.
僅限邀請腳本
僅作者批准的使用者才能訪問此腳本。您需要申請並獲得使用許可,通常需在付款後才能取得。更多詳情,請依照作者以下的指示操作,或直接聯絡gregoirejohnb。
TradingView不建議在未完全信任作者並了解其運作方式的情況下購買或使用腳本。您也可以在我們的社群腳本中找到免費的開源替代方案。
作者的說明
免責聲明
這些資訊和出版物並非旨在提供,也不構成TradingView提供或認可的任何形式的財務、投資、交易或其他類型的建議或推薦。請閱讀使用條款以了解更多資訊。
僅限邀請腳本
僅作者批准的使用者才能訪問此腳本。您需要申請並獲得使用許可,通常需在付款後才能取得。更多詳情,請依照作者以下的指示操作,或直接聯絡gregoirejohnb。
TradingView不建議在未完全信任作者並了解其運作方式的情況下購買或使用腳本。您也可以在我們的社群腳本中找到免費的開源替代方案。
作者的說明
免責聲明
這些資訊和出版物並非旨在提供,也不構成TradingView提供或認可的任何形式的財務、投資、交易或其他類型的建議或推薦。請閱讀使用條款以了解更多資訊。