OPEN-SOURCE SCRIPT
已更新 Price Action Signals V2
Indicator that shows buy/sell signals based on price action and volume as it relates to a double EMA. If the candle is above the double EMA, we look for candles with long wicks on the top indicating selling pressure. If the candle is below the double EMA , we look for candles with a long bottom wick indicating buying pressure. The user defined parameters are the length of the double EMA and the length of the volume moving average. Lower timeframes such as 5 minutes and lower are better off using lower lengths while higher timeframes should user higher lengths. Your mileage will vary.
Note, while this indicator can signal the beginning of long term trends, it will also signal minor retracements. Do not blindly buy or sell based on a signal appearing, pay attention to where the candle is in the overall trend and wait for confirmation to avoid losses.
Note, while this indicator can signal the beginning of long term trends, it will also signal minor retracements. Do not blindly buy or sell based on a signal appearing, pay attention to where the candle is in the overall trend and wait for confirmation to avoid losses.
發行說明
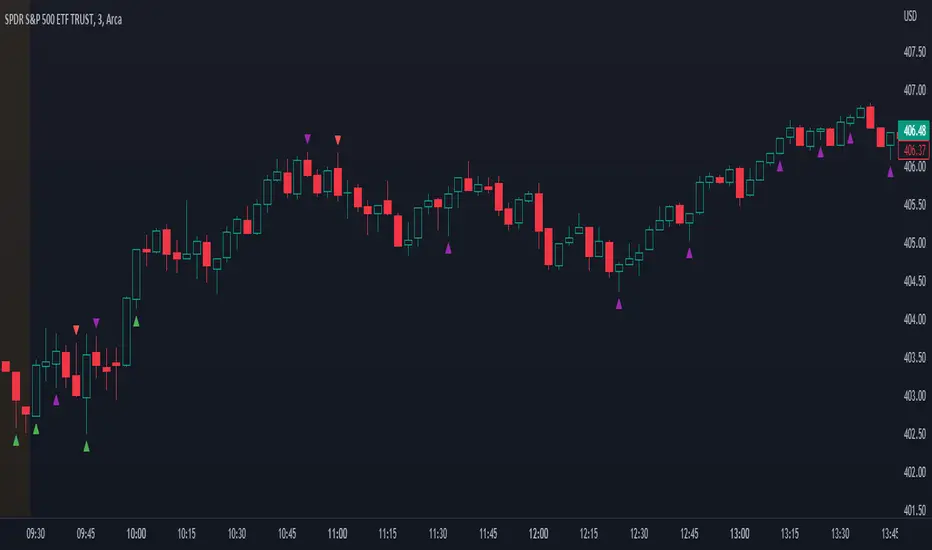
Chart update to show intraday.發行說明
Changed default setting for showing the Double EMA and commented out plots that aren't needed.發行說明
Made some updates for more granular control. There's now a spread you can choose for candles to determine what makes a candle large, an irregular body setting to determine what you consider to be an irregular candle spread on large volume. I also changed the default set up for intraday trading.- Fixed bug with plot showing at bottom of the chart, which was squishing the entire chart.
發行說明
Added notes for the colors of arrows. Red and green candles denote strong market movement, purple arrows denote weakness and possible reversals.發行說明
Removed candle color condition for more accurate results.發行說明
Added check to make sure that we don't put two arrows on one candle.發行說明
Finally got rid of the moving average separator. Purple arrows now mean small spread OR low volume with strong price action.發行說明
Added the ability to remove irregular arrows from display to keep indicator more clean. Also changed default settings.發行說明
Added high volume condition to irregular bodies.發行說明
Updated chart發行說明
Had to remove extra indicator for new chart發行說明
Fixed bug that caused a buy arrow and sell arrow to show up at the same time.開源腳本
秉持TradingView一貫精神,這個腳本的創作者將其設為開源,以便交易者檢視並驗證其功能。向作者致敬!您可以免費使用此腳本,但請注意,重新發佈代碼需遵守我們的社群規範。
免責聲明
這些資訊和出版物並非旨在提供,也不構成TradingView提供或認可的任何形式的財務、投資、交易或其他類型的建議或推薦。請閱讀使用條款以了解更多資訊。
開源腳本
秉持TradingView一貫精神,這個腳本的創作者將其設為開源,以便交易者檢視並驗證其功能。向作者致敬!您可以免費使用此腳本,但請注意,重新發佈代碼需遵守我們的社群規範。
免責聲明
這些資訊和出版物並非旨在提供,也不構成TradingView提供或認可的任何形式的財務、投資、交易或其他類型的建議或推薦。請閱讀使用條款以了解更多資訊。