OPEN-SOURCE SCRIPT
已更新 MTF ohlc S/R
A very simple idea, a close (or high, low, ohlc4 or open) from a higher Time Frame
will give future Support/Resistance area's
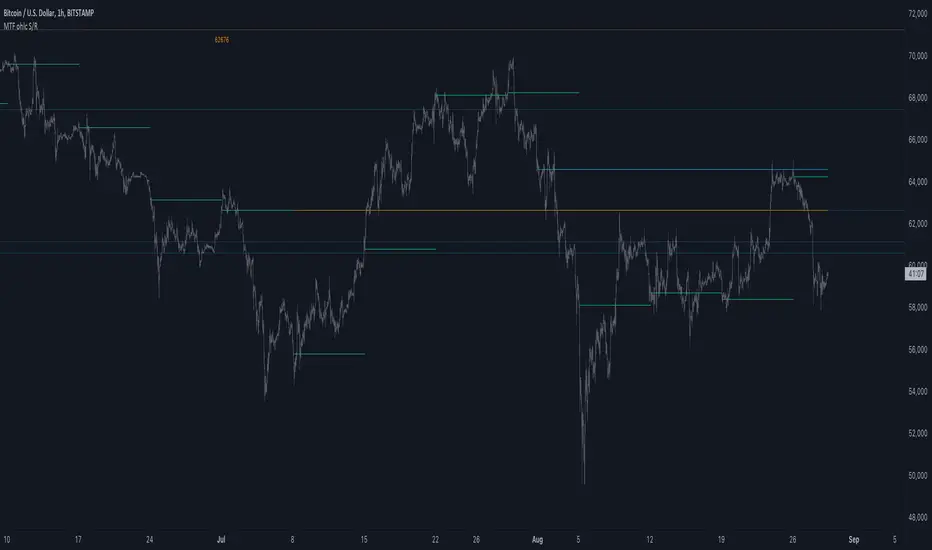
In this example of BTC/USD we see:
- Yearly close 2017 gave Resistance in June 2019
- Yearly close 2018 gave Support in March 2020

We are now pushing to the Resistance of Yearly close 2019...
Since there is a limit for the amount of lines (since it is just too much if everything is plotted)
there are different options:
- 4 different Time Frames, each can be enabled/disabled,
- TF can be chosen,
- source can be changed (close, open, high, low, ohlc4)
- Period can be changed, for example TF Month:

You can choose just to show a particular year, Month,...


You also can choose between which prices you want to see lines,
for example Monthly close, since the beginning till now, but only between $6000 - $8000:


This helps to know the closest S/R around the present price
Other example:

- Lines can be extended to the right, or not
- Labels can be enabled/disabled:


- Linewidth and brightness of the line can be changed, also the style (solid, dashed or dotted line)
Default only 2 very high TF's are enabled (3 Month = one quarter, and 1 Year)
The 3 Month has a dotted line, which helps distinguish the line against the yearly line
- Prices above 1000 are rounded since it seems distracting to see for example 6478,878654,
seems better just to see 6479, prices below 1000 are just seen as intended
Have fun!
will give future Support/Resistance area's
In this example of BTC/USD we see:
- Yearly close 2017 gave Resistance in June 2019
- Yearly close 2018 gave Support in March 2020
We are now pushing to the Resistance of Yearly close 2019...
Since there is a limit for the amount of lines (since it is just too much if everything is plotted)
there are different options:
- 4 different Time Frames, each can be enabled/disabled,
- TF can be chosen,
- source can be changed (close, open, high, low, ohlc4)
- Period can be changed, for example TF Month:
You can choose just to show a particular year, Month,...
You also can choose between which prices you want to see lines,
for example Monthly close, since the beginning till now, but only between $6000 - $8000:
This helps to know the closest S/R around the present price
Other example:
- Lines can be extended to the right, or not
- Labels can be enabled/disabled:
- Linewidth and brightness of the line can be changed, also the style (solid, dashed or dotted line)
Default only 2 very high TF's are enabled (3 Month = one quarter, and 1 Year)
The 3 Month has a dotted line, which helps distinguish the line against the yearly line
- Prices above 1000 are rounded since it seems distracting to see for example 6478,878654,
seems better just to see 6479, prices below 1000 are just seen as intended
Have fun!
發行說明
Added color choice (Color 1 or 2) with different brightness發行說明
Updated to v5.Elevated the line limit to 500.
開源腳本
秉持TradingView一貫精神,這個腳本的創作者將其設為開源,以便交易者檢視並驗證其功能。向作者致敬!您可以免費使用此腳本,但請注意,重新發佈代碼需遵守我們的社群規範。
Who are PineCoders?
tradingview.com/chart/SSP/yW5eOqtm-Who-are-PineCoders/
TG Pine Script® Q&A: t.me/PineCodersQA
- We cannot control our emotions,
but we can control our keyboard -
tradingview.com/chart/SSP/yW5eOqtm-Who-are-PineCoders/
TG Pine Script® Q&A: t.me/PineCodersQA
- We cannot control our emotions,
but we can control our keyboard -
免責聲明
這些資訊和出版物並非旨在提供,也不構成TradingView提供或認可的任何形式的財務、投資、交易或其他類型的建議或推薦。請閱讀使用條款以了解更多資訊。