OPEN-SOURCE SCRIPT
Yield Curve Regimes
Currently we are seeing equities and all other risk assets rallying to new all time high. But when will this stop?
There are multiple risks/signals i am monitoring to stay at the right side of the macro trade. Macro is everything: “When you get the Big-Picture wrong you wont live long.”
So lets go through a major risk that could be the catalyst for the next deeper correction
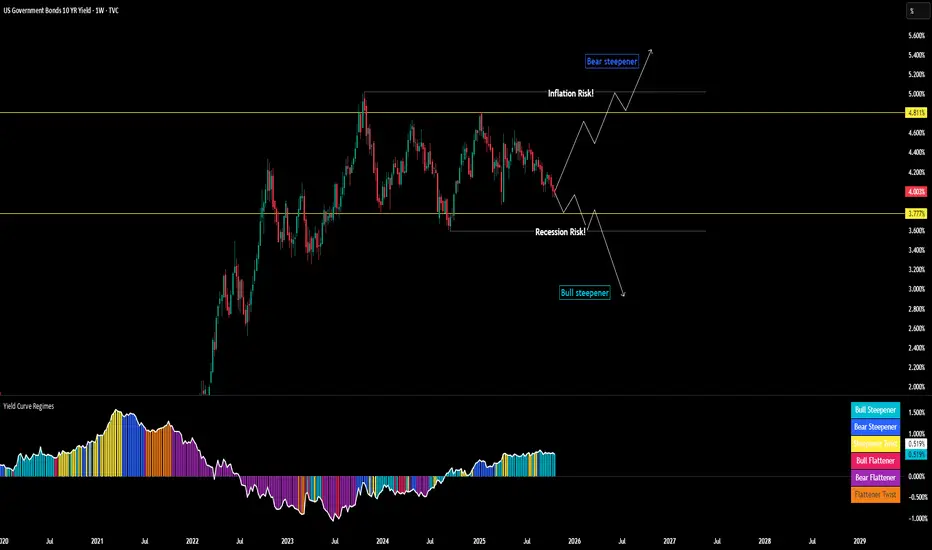
Capital needs to begin to move BACK across the risk curve as the yield curve steepens. We don't know if the source of the the crash will be from bear steepening or bull steepening because its unclear if long end rates blowing out will be the source of the crash.
If the Fed continues to make the policy error of being overly accommodative at this high level of nominal GDP + Inflation risk, the long end of the curve will price this.
Simple: If the Fed is to lose the long end can move up to price the inflation risk, which could ultimately pull risk assets down.
We have not seen this yet because the last inflation prints came in flat, but I expect these to come in higher over the next 6 months.
This means watching long end rates and their potential drag on equities will be critical. We are not seeing this yet as the Russell is sitting at all time highs and capital continues to move into low quality factors.
Look where the long end is moving + the attribution analysis for the move.
→ Down growth risk
→ Up Inflation risk
+ look what the 2s10s & the 10s30 are pricing and how these changes in the curve connect to the current yield curve regimes.
You can get the Trading view Skript 100% free here
There are multiple risks/signals i am monitoring to stay at the right side of the macro trade. Macro is everything: “When you get the Big-Picture wrong you wont live long.”
So lets go through a major risk that could be the catalyst for the next deeper correction
Capital needs to begin to move BACK across the risk curve as the yield curve steepens. We don't know if the source of the the crash will be from bear steepening or bull steepening because its unclear if long end rates blowing out will be the source of the crash.
If the Fed continues to make the policy error of being overly accommodative at this high level of nominal GDP + Inflation risk, the long end of the curve will price this.
Simple: If the Fed is to lose the long end can move up to price the inflation risk, which could ultimately pull risk assets down.
We have not seen this yet because the last inflation prints came in flat, but I expect these to come in higher over the next 6 months.
This means watching long end rates and their potential drag on equities will be critical. We are not seeing this yet as the Russell is sitting at all time highs and capital continues to move into low quality factors.
Look where the long end is moving + the attribution analysis for the move.
→ Down growth risk
→ Up Inflation risk
+ look what the 2s10s & the 10s30 are pricing and how these changes in the curve connect to the current yield curve regimes.
You can get the Trading view Skript 100% free here
開源腳本
In true TradingView spirit, the creator of this script has made it open-source, so that traders can review and verify its functionality. Kudos to the author! While you can use it for free, remember that republishing the code is subject to our House Rules.
免責聲明
The information and publications are not meant to be, and do not constitute, financial, investment, trading, or other types of advice or recommendations supplied or endorsed by TradingView. Read more in the Terms of Use.