INVITE-ONLY SCRIPT
已更新 Stock Crash Risk (SCR)
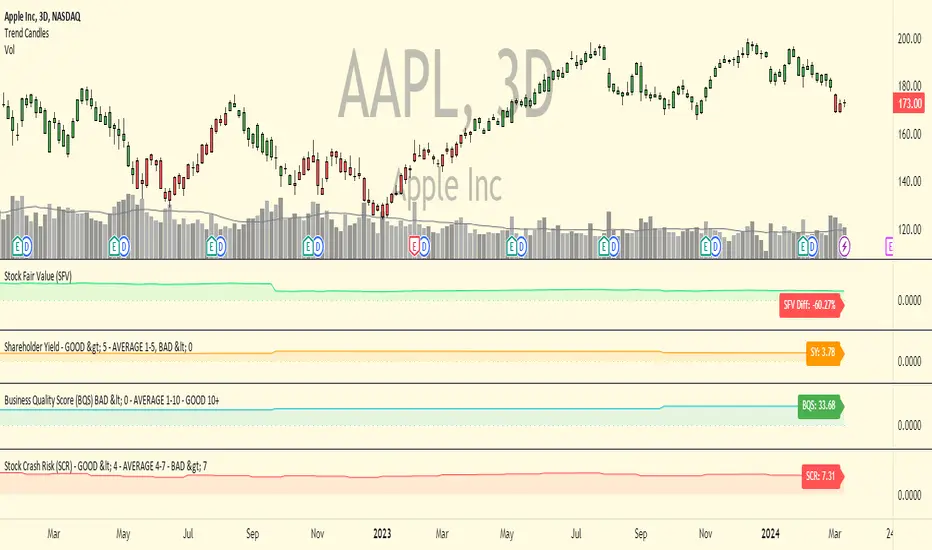
Stock Crash Risk (SCR) is an indicator that can be used to identify when a stock may be vulnerable to a crash. It's value is always between 1 meaning a very low risk of a crash to a high of 10 meaning a very high risk of a crash. Generally speaking readings above 8 should be considered high and caution used when investing in a stock. The only setting that can be changed by users is the lookback which by default is set to 7, meaning the indicator looks back at 7 months of price data to help determine the reading, it's recommended that users leave this setting to the default. This indicator is not designed for short term trading, the implications of high readings are usually months in advance so it's more suited towards stock investors however it can still be used to gauge potential crash risks for shorter term trades.
The indicator uses both price action and fundamental valuation metrics to calculate the reading. Generally speaking, when a stock price exhibits both extreme price sentiment and valuation it's likely to crash at some point. This indicator can also be used for the opposite use, meaning when it has a low reading under 3 it could be a good time to buy since both price and valuation are low.
This indicator is best used on stocks on the daily, weekly and monthly timeframes. It's value will always be the same regardless of what timeframe is used. Since it uses stock valuation this indicator cannot be used on other markets like forex, futures or crypto.
In the chart above you can see it applied to Peloton PTON on the weekly timeframe, you can see for most of the latter part of 2020 it had high readings above 9 indicating the stock is vulnerable to a crash which did subsequently happen over the following year. After reaching a high price of $171 in early January 2021 it fell 82% to a low of $31 within a year.
Below is another example of Zoom Video ZM with a similar pattern to Peloton, after showing high Stock Crash Risk readings above 9 it did subsequently crash over 70% the following 12 months.

Here's another example with Upstart UPST, after reaching a peak price of $401 in October 2021 with a SCR reading of 9.45 it subsequently crashed more than 73% over the next 3 months.

To get access to this indicator PM or email me to my address shown below.
Enjoy :)
Disclaimer: All my scripts and content are for educational purposes only. I'm not a financial advisor and do not give personal finance advice. Past performance is no guarantee of future performance. Please trade at your own risk.
The indicator uses both price action and fundamental valuation metrics to calculate the reading. Generally speaking, when a stock price exhibits both extreme price sentiment and valuation it's likely to crash at some point. This indicator can also be used for the opposite use, meaning when it has a low reading under 3 it could be a good time to buy since both price and valuation are low.
This indicator is best used on stocks on the daily, weekly and monthly timeframes. It's value will always be the same regardless of what timeframe is used. Since it uses stock valuation this indicator cannot be used on other markets like forex, futures or crypto.
In the chart above you can see it applied to Peloton
Below is another example of Zoom Video
Here's another example with Upstart
To get access to this indicator PM or email me to my address shown below.
Enjoy :)
Disclaimer: All my scripts and content are for educational purposes only. I'm not a financial advisor and do not give personal finance advice. Past performance is no guarantee of future performance. Please trade at your own risk.
發行說明
Updated indicator visualization for easier interpretation. Indicator logic remain the same.僅限邀請腳本
僅作者批准的使用者才能訪問此腳本。您需要申請並獲得使用許可,通常需在付款後才能取得。更多詳情,請依照作者以下的指示操作,或直接聯絡Click-Capital。
TradingView不建議在未完全信任作者並了解其運作方式的情況下購買或使用腳本。您也可以在我們的社群腳本中找到免費的開源替代方案。
作者的說明
Contact me using TradingView private chat or email me at scale@greenstonedigital.com to request access to my invite-only scripts.
免責聲明
這些資訊和出版物並非旨在提供,也不構成TradingView提供或認可的任何形式的財務、投資、交易或其他類型的建議或推薦。請閱讀使用條款以了解更多資訊。
僅限邀請腳本
僅作者批准的使用者才能訪問此腳本。您需要申請並獲得使用許可,通常需在付款後才能取得。更多詳情,請依照作者以下的指示操作,或直接聯絡Click-Capital。
TradingView不建議在未完全信任作者並了解其運作方式的情況下購買或使用腳本。您也可以在我們的社群腳本中找到免費的開源替代方案。
作者的說明
Contact me using TradingView private chat or email me at scale@greenstonedigital.com to request access to my invite-only scripts.
免責聲明
這些資訊和出版物並非旨在提供,也不構成TradingView提供或認可的任何形式的財務、投資、交易或其他類型的建議或推薦。請閱讀使用條款以了解更多資訊。