OPEN-SOURCE SCRIPT
HIGH LOW SAR
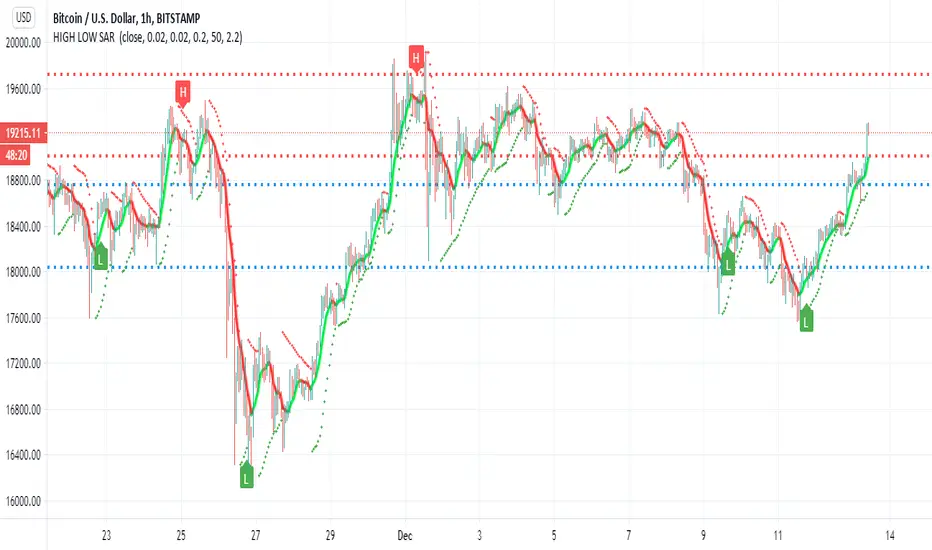
This script i try to detect high and low using SAR
the red and blue lines represent present and past support and resistance level
the trend line in lime and red is Hull
sar signals of high and low are done by cross of SAR and bollinger channel upper and lower and condition that it either below or above the resistance and support levels
there are alerts but i think as a bot it not so good , better to use this one as idea for possible high and low where the targets are shown by resistance and support level
this is just idea how to make the SAR to show us high and low , maybe with more refinement it would be better
開源腳本
In true TradingView spirit, the creator of this script has made it open-source, so that traders can review and verify its functionality. Kudos to the author! While you can use it for free, remember that republishing the code is subject to our House Rules.
免責聲明
The information and publications are not meant to be, and do not constitute, financial, investment, trading, or other types of advice or recommendations supplied or endorsed by TradingView. Read more in the Terms of Use.