INVITE-ONLY SCRIPT
Seasonality by Luis Trompeter
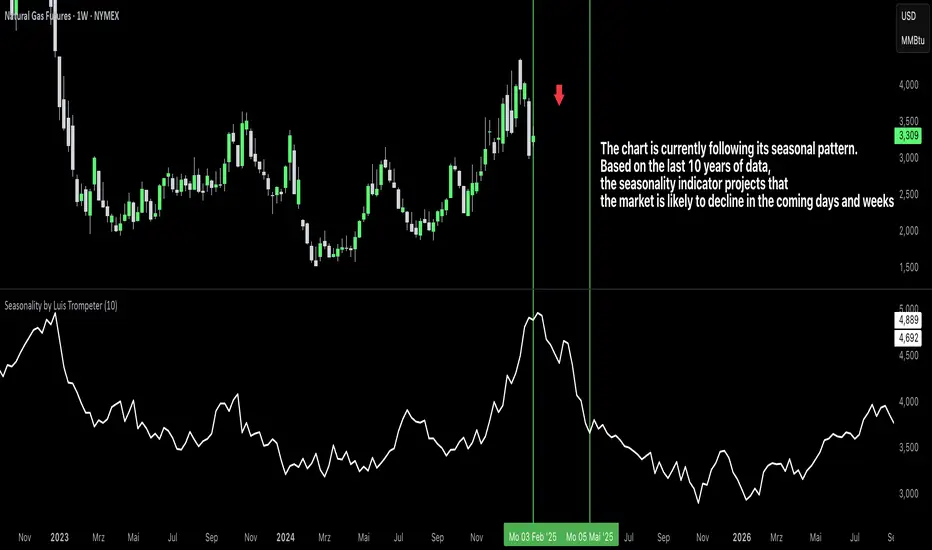
The Seasonality Indicator calculates the average historical performance of the currently selected asset by analyzing a user-defined number of past years (e.g., the last 10 years).
The number of years included in the calculation can be adjusted directly in the settings panel.
Based on this historical window, the indicator creates an average seasonal curve, which represents how the market typically behaved during each part of the year.
This averaged curve acts as a forecast for the upcoming months, highlighting periods where the market has shown a consistent tendency in the past.
Traders can use this seasonal projection to identify times of higher statistical likelihood for upward or downward movement.
The indicator works especially well when combined with the Seasonality Analysis Tool, which helps identify specific historical windows and strengthens overall seasonal decision-making.
Timeframe Requirement
This indicator must be used exclusively on the daily timeframe, as all calculations are based on daily candle data.
Other timeframes will not display accurate seasonal structures.
The Seasonality Indicator provides a clear, data-driven view of recurring annual patterns and allows traders to better understand when historical tendencies may influence future price action.
僅限邀請腳本
僅作者批准的使用者才能訪問此腳本。您需要申請並獲得使用許可,通常需在付款後才能取得。更多詳情,請依照作者以下的指示操作,或直接聯絡luistrompeter。
TradingView不建議在未完全信任作者並了解其運作方式的情況下購買或使用腳本。您也可以在我們的社群腳本中找到免費的開源替代方案。
作者的說明
This indicator can soon be accessed through the TradingView Paid Spaces system.
Purchasing through TradingView ensures secure payment processing, proper access management, and reliable availability for all users.
免責聲明
這些資訊和出版物並非旨在提供,也不構成TradingView提供或認可的任何形式的財務、投資、交易或其他類型的建議或推薦。請閱讀使用條款以了解更多資訊。