OPEN-SOURCE SCRIPT
已更新 Previous High/Low MTF
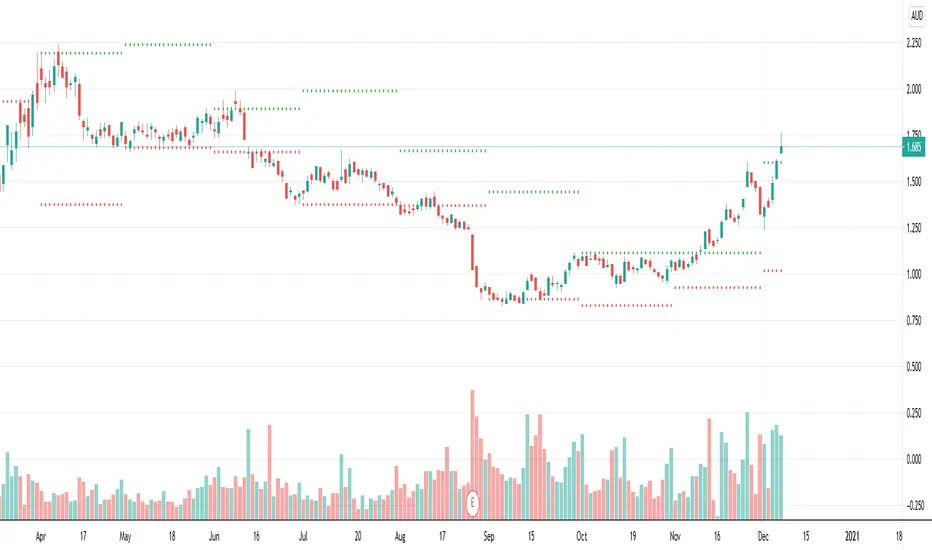
Indicator to plot higher time frame previous candle highs and lows.
One of the key factor in understanding the trend is to look at higher time-frames chart.
Parameters are explained below:
One of the key factor in understanding the trend is to look at higher time-frames chart.
Parameters are explained below:
- resolution : Chose resolution of higher timeframe. If set to same as symbol, it will consider next parameter HTFMultiplier for calculation of higher timeframe
- HTFMultiplier : Multiply symbol timeframe to by HTFMultiplier to derive higher time-frame
- Offset: Number of higher timeframe candles before to be plotted. 1 means - it will show highs/lows of previous higher timeframe candle.
發行說明
Also adding few options to explain how lookahead, gaps and offset on security function affect output. Default settings are set to show the optimal non repaint version.開源腳本
秉持TradingView一貫精神,這個腳本的創作者將其設為開源,以便交易者檢視並驗證其功能。向作者致敬!您可以免費使用此腳本,但請注意,重新發佈代碼需遵守我們的社群規範。
Trial - trendoscope.io/trial
Subscribe - trendoscope.io/pricing
Blog - docs.trendoscope.io
Subscribe - trendoscope.io/pricing
Blog - docs.trendoscope.io
免責聲明
這些資訊和出版物並非旨在提供,也不構成TradingView提供或認可的任何形式的財務、投資、交易或其他類型的建議或推薦。請閱讀使用條款以了解更多資訊。
開源腳本
秉持TradingView一貫精神,這個腳本的創作者將其設為開源,以便交易者檢視並驗證其功能。向作者致敬!您可以免費使用此腳本,但請注意,重新發佈代碼需遵守我們的社群規範。
Trial - trendoscope.io/trial
Subscribe - trendoscope.io/pricing
Blog - docs.trendoscope.io
Subscribe - trendoscope.io/pricing
Blog - docs.trendoscope.io
免責聲明
這些資訊和出版物並非旨在提供,也不構成TradingView提供或認可的任何形式的財務、投資、交易或其他類型的建議或推薦。請閱讀使用條款以了解更多資訊。