OPEN-SOURCE SCRIPT
已更新 Fibonacci Warzone Boxes
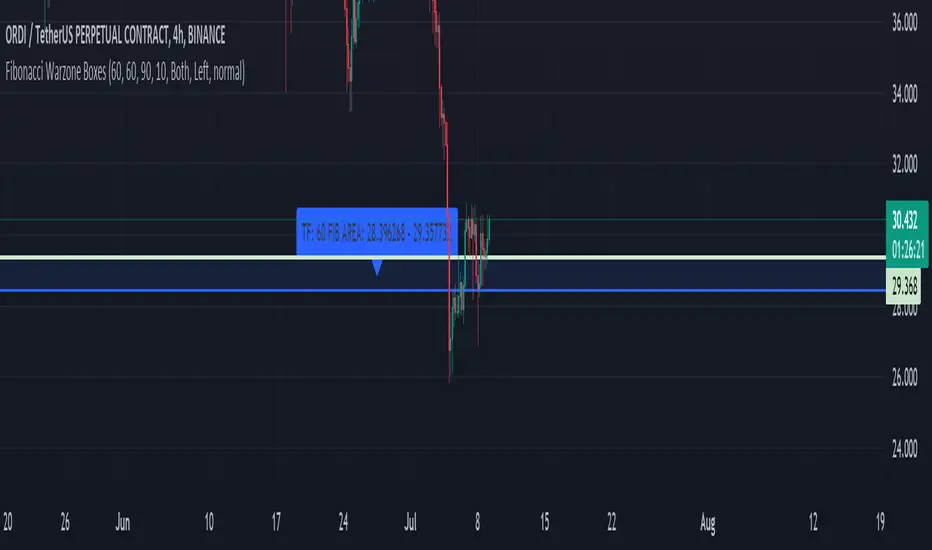
The "Fibonacci Warzone Boxes" is a unique trading indicator that leverages the power of Fibonacci retracement levels to identify critical support and resistance zones. Designed for both seasoned traders and novices, this tool dynamically calculates the 38.2% and 61.8% retracement levels from the highest and lowest prices within a user-defined lookback period and timeframe. By highlighting these zones, the indicator assists traders in making informed decisions about entry and exit points.
Unlike standard Fibonacci tools, the "Fibonacci Warzone Boxes" provides a visual representation of Fibonacci levels in the form of easy-to-interpret boxes, enhancing the decision-making process. This method helps traders quickly understand where significant price action can occur, improving their reaction time and strategic approach to the markets.
A. Key Features:
- Dynamic Fibonacci Levels: Automatically updates Fibonacci retracement levels based on the price action within the selected timeframe and lookback period.
- Customizable Settings: Users can easily adjust the timeframe, lookback period, and box transparency to suit their trading style and the specific characteristics of the asset they are trading.
- Visual Effectiveness: The indicator uses colored boxes (customizable in terms of color and transparency) to clearly denote the Fibonacci war zones, making it easy to spot key levels at a glance.
B. Usage:
To use this indicator, simply apply it to any chart and set the desired timeframe and lookback period. The indicator is particularly useful in markets with clear trends where Fibonacci levels can predict potential reversal points.
C. Benefits:
Enhanced Decision Making: Helps traders identify potential buy and sell zones based on historical price levels.
Adaptability: Works on any timeframe and with any market, making it a versatile tool for various trading strategies.
Ease of Use: Designed with a user-friendly interface, requiring minimal setup for optimal performance.
D. Guidelines for Use:
Ensure your chart is uncluttered to make the best use of this indicator.
Adjust the settings based on the volatility and characteristics of the market you are trading.
Combine this tool with other indicators for a comprehensive trading strategy, but avoid overcrowding the chart to maintain clarity.
發行說明
Adding possibility to change the color off the box發行說明
Adding labels containing timeframe and fib levels.Adding option to extend boxes
發行說明
Bug Fixing:- changing chart time frame should not impact the calculation
Improvements :
- possibility to change location of the label and text size
開源腳本
秉持TradingView一貫精神,這個腳本的創作者將其設為開源,以便交易者檢視並驗證其功能。向作者致敬!您可以免費使用此腳本,但請注意,重新發佈代碼需遵守我們的社群規範。
免責聲明
這些資訊和出版物並非旨在提供,也不構成TradingView提供或認可的任何形式的財務、投資、交易或其他類型的建議或推薦。請閱讀使用條款以了解更多資訊。
開源腳本
秉持TradingView一貫精神,這個腳本的創作者將其設為開源,以便交易者檢視並驗證其功能。向作者致敬!您可以免費使用此腳本,但請注意,重新發佈代碼需遵守我們的社群規範。
免責聲明
這些資訊和出版物並非旨在提供,也不構成TradingView提供或認可的任何形式的財務、投資、交易或其他類型的建議或推薦。請閱讀使用條款以了解更多資訊。