OPEN-SOURCE SCRIPT
SMS Indicator [Nicholas Merten]
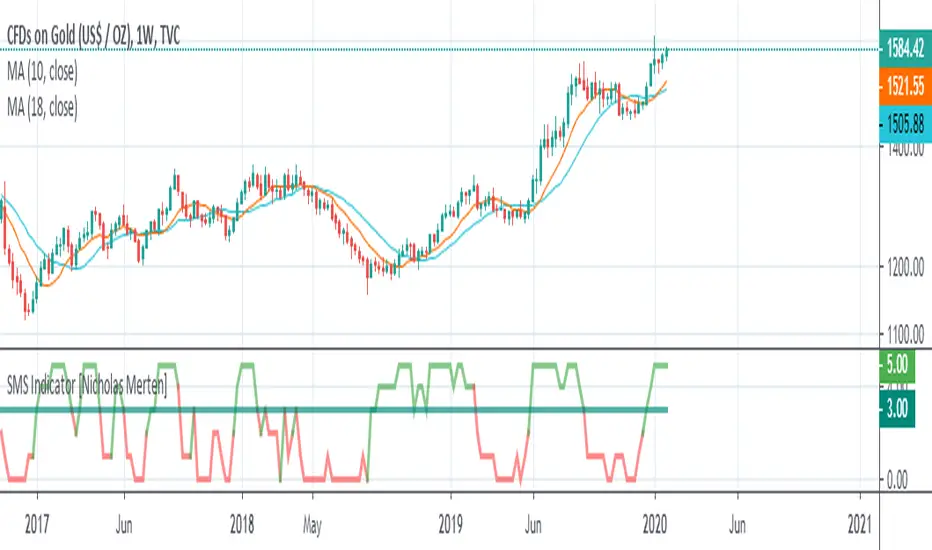
SMS is the acronym for the combination of the three prominent indicators; the squeeze momentum, MACD and Stochastic RSI indicator. It aggregates all of three lagging indicators to derive the trend of an underlying instrument. The script outcome works best when applied on weekly, standard charts (i.e. candles stick charts).
In general terms, these are the rules that define the indicator. But bear in mind, there are other miscellaneous factors that can determine the SMS indicator. (Feel free to review the pine code if you'd like):
"If the squeeze momentum is setting a higher weekly candle, add a point"
"If the MACD is closing its divergence from a descending movement, add a point"
"If the MACD crosses to the upside, add a point"
"If the blue line crosses the orange at the bottom of the Stochastic RSI , add one point"
"If the two lines have entered the purple channel from the bottom of the Stochastic RSI , add one point"
If the score is 3/5 or more, the indicator is flashing a bullish signal . If it's 2/5 or below, the indicator is flashing a bearish signal.
You can easily create an alert to trigger when there's a 3/5 point cross or a cross below 2/5, gearing up for a potential reversal in trend.
Finally, don't just trade on this indicator alone. This indicator is not meant to be used alone, rather, it can be a useful guide to understand the generic trend of an instrument by merging together a lot of leading indicators.
開源腳本
秉持TradingView一貫精神,這個腳本的創作者將其設為開源,以便交易者檢視並驗證其功能。向作者致敬!您可以免費使用此腳本,但請注意,重新發佈代碼需遵守我們的社群規範。
免責聲明
這些資訊和出版物並非旨在提供,也不構成TradingView提供或認可的任何形式的財務、投資、交易或其他類型的建議或推薦。請閱讀使用條款以了解更多資訊。
開源腳本
秉持TradingView一貫精神,這個腳本的創作者將其設為開源,以便交易者檢視並驗證其功能。向作者致敬!您可以免費使用此腳本,但請注意,重新發佈代碼需遵守我們的社群規範。
免責聲明
這些資訊和出版物並非旨在提供,也不構成TradingView提供或認可的任何形式的財務、投資、交易或其他類型的建議或推薦。請閱讀使用條款以了解更多資訊。