OPEN-SOURCE SCRIPT
Trend Trading With Moving Averages (by ChartArt)
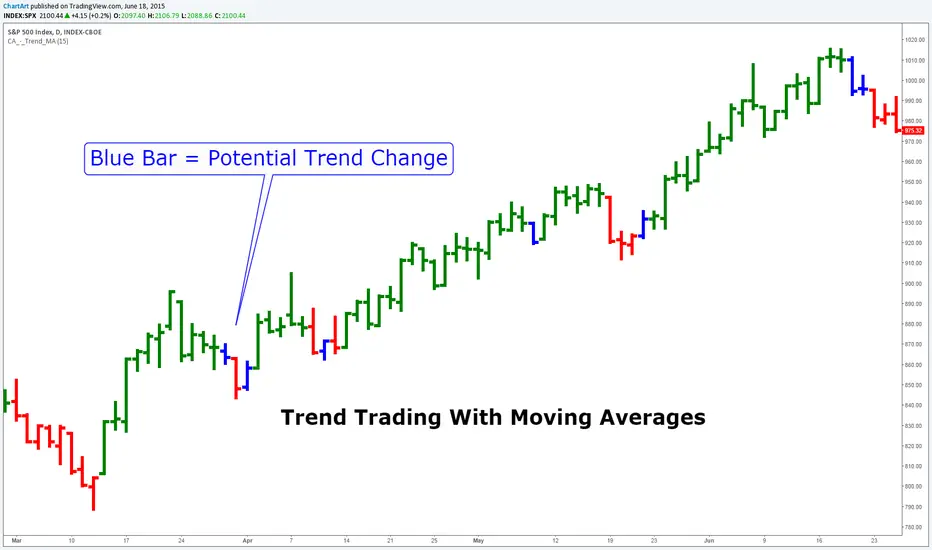
This indicator is measuring if three different moving average calculations (EMA,WMA,SMA) with the same period length are aligned in an uptrend. If this is the case then the bar is colored in green. If only one or two of the three moving averages signals an uptrend then the bar is colored in blue. This can mean that the trend is changing.
Save another $999 bucks with this free indicator.
This is the ChartArt optimized version. Original idea: Steve Primo's Robbery Indicator (PET-D).
coded by UCSgears:
Save another $999 bucks with this free indicator.
This is the ChartArt optimized version. Original idea: Steve Primo's Robbery Indicator (PET-D).
coded by UCSgears:
開源腳本
本著TradingView的真正精神,此腳本的創建者將其開源,以便交易者可以查看和驗證其功能。向作者致敬!雖然您可以免費使用它,但請記住,重新發佈程式碼必須遵守我們的網站規則。
免責聲明
這些資訊和出版物並不意味著也不構成TradingView提供或認可的金融、投資、交易或其他類型的意見或建議。請在使用條款閱讀更多資訊。
開源腳本
本著TradingView的真正精神,此腳本的創建者將其開源,以便交易者可以查看和驗證其功能。向作者致敬!雖然您可以免費使用它,但請記住,重新發佈程式碼必須遵守我們的網站規則。
免責聲明
這些資訊和出版物並不意味著也不構成TradingView提供或認可的金融、投資、交易或其他類型的意見或建議。請在使用條款閱讀更多資訊。