OPEN-SOURCE SCRIPT
已更新 cd_secret_candlestick_patterns_Cx
Hi traders,
With this indicator, we aim to uncover secret candlestick formations that even advanced traders may miss—especially those that can't be detected by classic pattern indicators, unless you're a true master of candlestick patterns or candle math.
________________________________________
General Idea:
We'll try to identify candlestick patterns by regrouping candles into custom-sized segments that you define.
You might ask: “Why do I need this? I can just look at different timeframes and spot the structure anyway.” But it’s not the same.
For example, if you're using a 1-minute chart and add a higher-timeframe candle overlay (like 5-minute), the candles you see start at fixed timestamps like 0, 5, 10, etc.
However, in this indicator, we redraw new candles by grouping them from the current candle backward in batches of five.
These candles won't match the standard view—only when aligned with exact time multiples (e.g., 0 and 5 minutes) will they look the same.
In classic charts:
• You see 5-minute candles that begin every 0 and 5 minutes.
In this tool:
• You see a continuously updating set of 5 merged 1-minute candles redrawn every minute.
What about the structures forming in between those fixed timeframes?
That’s exactly what we’ll be able to detect—while also making the lower timeframe chart more readable.
________________________________________
Candle Merging:
Let’s continue with an example.
Assume we choose to merge 5 candles. Then the new candle will be formed using:
open = open[4]
close = close[0]
high = math.max(high[4], high[3], high[2], high[1], high)
low = math.min(low[4], low[3], low[2], low[1], low)
This logic continues backward on the chart, creating merged candles in groups of 5.
Since the selected patterns are made up of 3, 4, or 5 candles, we redraw 5 such merged candles to analyze.
________________________________________
Which Patterns Are Included?
A total of 18 bullish and bearish patterns are included.
You’ll find both widely known formations and a few personal ones I use, marked as (MeReT).
You can find the pattern list and visual reference here:

________________________________________
Entry and Filtering Suggestions:
Let me say this clearly:
Entering a trade every time a pattern forms will not make you profitable in the long run.
You need a clear trade plan and should only act when you can answer questions like:
• Where did the pattern appear?
• When and under what conditions?
It’s more effective to trade in the direction of the trend and look for setups around support/resistance, supply/demand zones, key levels, or areas confirmed by other indicators.
Whether you enter immediately after the pattern or wait for a retest is a personal choice—but risk management is non-negotiable.
One of the optional filters I’ve included is a Higher Timeframe (HTF) condition, which is my personal preference:
When enabled, the highest or lowest price among the pattern candles must match the high or low of the current HTF candle.
You can see in the image below the decrease in the number of detected patterns on the 1-minute chart when using no filter (blue labels) compared to when the 1-hour timeframe filter is applied (red labels).

Additionally, I’ve added a “protected” condition for engulfing patterns to help filter out weak classic engulf patterns.
________________________________________
Settings:
From the menu, you can configure:
• Number of candles for regrouping
• Distance between the last candle and newly drawn candles
• Show/hide options
• HTF filter toggle and timeframe selection
• Color, label placement, and text customization
• Pattern list (select which to display or trigger alerts for)
My preferred setup:
While trading on the 1-minute chart, I typically set the higher timeframe to 15m or 1H, and switch the candle count between 2 and 3 depending on the situation.
⚠️ Important note:
The “Show” and “Alert” options are controlled by a single command.
Alerts are automatically created for any pattern you choose to display.
________________________________________
What’s Next?
In future updates, I plan to add:
• Pattern success rate statistics
• Multi-broker confirmation for pattern validation
Lastly, keep in mind:
The more candles a pattern is based on, the more reliable it may be.
I'd love to hear your feedback and suggestions.
Cheerful trading! 🕊️📈
With this indicator, we aim to uncover secret candlestick formations that even advanced traders may miss—especially those that can't be detected by classic pattern indicators, unless you're a true master of candlestick patterns or candle math.
________________________________________
General Idea:
We'll try to identify candlestick patterns by regrouping candles into custom-sized segments that you define.
You might ask: “Why do I need this? I can just look at different timeframes and spot the structure anyway.” But it’s not the same.
For example, if you're using a 1-minute chart and add a higher-timeframe candle overlay (like 5-minute), the candles you see start at fixed timestamps like 0, 5, 10, etc.
However, in this indicator, we redraw new candles by grouping them from the current candle backward in batches of five.
These candles won't match the standard view—only when aligned with exact time multiples (e.g., 0 and 5 minutes) will they look the same.
In classic charts:
• You see 5-minute candles that begin every 0 and 5 minutes.
In this tool:
• You see a continuously updating set of 5 merged 1-minute candles redrawn every minute.
What about the structures forming in between those fixed timeframes?
That’s exactly what we’ll be able to detect—while also making the lower timeframe chart more readable.
________________________________________
Candle Merging:
Let’s continue with an example.
Assume we choose to merge 5 candles. Then the new candle will be formed using:
open = open[4]
close = close[0]
high = math.max(high[4], high[3], high[2], high[1], high)
low = math.min(low[4], low[3], low[2], low[1], low)
This logic continues backward on the chart, creating merged candles in groups of 5.
Since the selected patterns are made up of 3, 4, or 5 candles, we redraw 5 such merged candles to analyze.
________________________________________
Which Patterns Are Included?
A total of 18 bullish and bearish patterns are included.
You’ll find both widely known formations and a few personal ones I use, marked as (MeReT).
You can find the pattern list and visual reference here:
________________________________________
Entry and Filtering Suggestions:
Let me say this clearly:
Entering a trade every time a pattern forms will not make you profitable in the long run.
You need a clear trade plan and should only act when you can answer questions like:
• Where did the pattern appear?
• When and under what conditions?
It’s more effective to trade in the direction of the trend and look for setups around support/resistance, supply/demand zones, key levels, or areas confirmed by other indicators.
Whether you enter immediately after the pattern or wait for a retest is a personal choice—but risk management is non-negotiable.
One of the optional filters I’ve included is a Higher Timeframe (HTF) condition, which is my personal preference:
When enabled, the highest or lowest price among the pattern candles must match the high or low of the current HTF candle.
You can see in the image below the decrease in the number of detected patterns on the 1-minute chart when using no filter (blue labels) compared to when the 1-hour timeframe filter is applied (red labels).
Additionally, I’ve added a “protected” condition for engulfing patterns to help filter out weak classic engulf patterns.
________________________________________
Settings:
From the menu, you can configure:
• Number of candles for regrouping
• Distance between the last candle and newly drawn candles
• Show/hide options
• HTF filter toggle and timeframe selection
• Color, label placement, and text customization
• Pattern list (select which to display or trigger alerts for)
My preferred setup:
While trading on the 1-minute chart, I typically set the higher timeframe to 15m or 1H, and switch the candle count between 2 and 3 depending on the situation.
⚠️ Important note:
The “Show” and “Alert” options are controlled by a single command.
Alerts are automatically created for any pattern you choose to display.
________________________________________
What’s Next?
In future updates, I plan to add:
• Pattern success rate statistics
• Multi-broker confirmation for pattern validation
Lastly, keep in mind:
The more candles a pattern is based on, the more reliable it may be.
I'd love to hear your feedback and suggestions.
Cheerful trading! 🕊️📈
發行說明
Fixed an issue with retrieving HTF High/Low values.發行說明
With the new version:• The code has been reorganized to be more readable and easier to develop.
• While the previous version tracked patterns using a single sequence, a second sequence has now been added for additional pattern tracking.
Usage:
You can select a time frame and the number of candles to generate new secret candles. By choosing the same or a different time frame, you can track patterns with various combinations based on the selected number of candles.
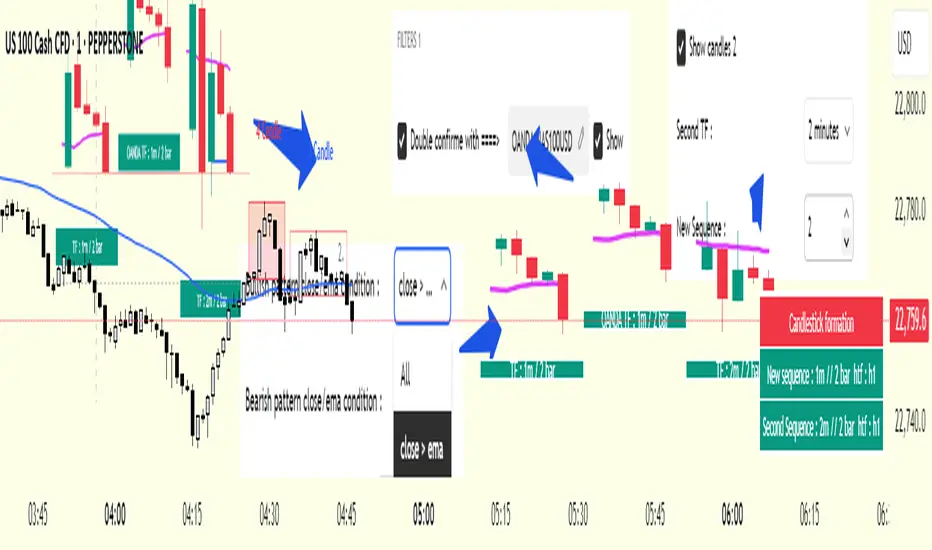
Patterns formed in the first sequence are displayed on the chart with filled color boxes, while patterns in the second sequence are shown with outlined boxes (no fill) and the pattern name is printed in a different color for easy distinction.
New filters added in this version (in addition to the higher time frame filter available in the previous version):
• EMA / pattern candle close condition
• Second pair confirmation filter
EMA / pattern candle close filter:
From the menu, you can choose the EMA length and filter condition. Options include:
• “All” (no EMA filtering applied)
• “close > EMA”
• “close < EMA”
Second pair confirmation filter:
To activate this, tick the box in the menu and specify the second pair. When the same pattern appears on both pairs in the same candle, the filter is considered confirmed.
Examples for clarity:
• Active pair: PEPPERSTONE:EURUSD → with OANDA:EURUSD (same symbol, different broker)
• Active pair: PEPPERSTONE:EURUSD → with OANDA:GBPUSD (different symbol, same or different broker)
• Active pair: BINANCE:BTCUSDT.P → with BINANCE:ETHUSDT.P (different symbol, same broker)
• Active pair: BINANCE:BTCUSDT.P → with COINBASE:BTCUSDT.P (same symbol, different broker)
• Active pair: BIST:THYO → with BIST:XU100 (symbol + index)
These can all be used for confirmation and as filters if the patterns form in the same candle across both instruments.
As a final note, please remember that not every pattern formation is a profitable trade. I’d be happy to hear about the results—good or bad—that you achieve using different variations, as well as any filtering suggestions you may have.
Happy trading!
發行說明
Adjustments:Adjustment in the color menu
Fixed incorrect second sequence alert and drawing issue triggered without candle close
New Feature:
Option to view the formed pattern as a single candle, depending on selection ("Single Candle")
Labeling the single candle if it is a "hammer" or "shooting star"
發行說明
For the Double Confirm option, previously we had to manually enter the confirmation pair whenever the pair on the screen changed. This caused time loss and potential errors.With the new version:
A feature has been added to define confirmation pairs for up to ten pairs through the menu.
If the pair opened on the screen is not one of the predefined pairs, we must manually enter it via the "Double Confirm With" section in the menu.
The defined or manually entered confirmation pair name will also be displayed in the table.
開源腳本
秉持TradingView一貫精神,這個腳本的創作者將其設為開源,以便交易者檢視並驗證其功能。向作者致敬!您可以免費使用此腳本,但請注意,重新發佈代碼需遵守我們的社群規範。
免責聲明
這些資訊和出版物並非旨在提供,也不構成TradingView提供或認可的任何形式的財務、投資、交易或其他類型的建議或推薦。請閱讀使用條款以了解更多資訊。
免責聲明
這些資訊和出版物並非旨在提供,也不構成TradingView提供或認可的任何形式的財務、投資、交易或其他類型的建議或推薦。請閱讀使用條款以了解更多資訊。