OPEN-SOURCE SCRIPT
Oracle Ema : sma simple
Indicator: Gradient Moving Average with Table
Overview
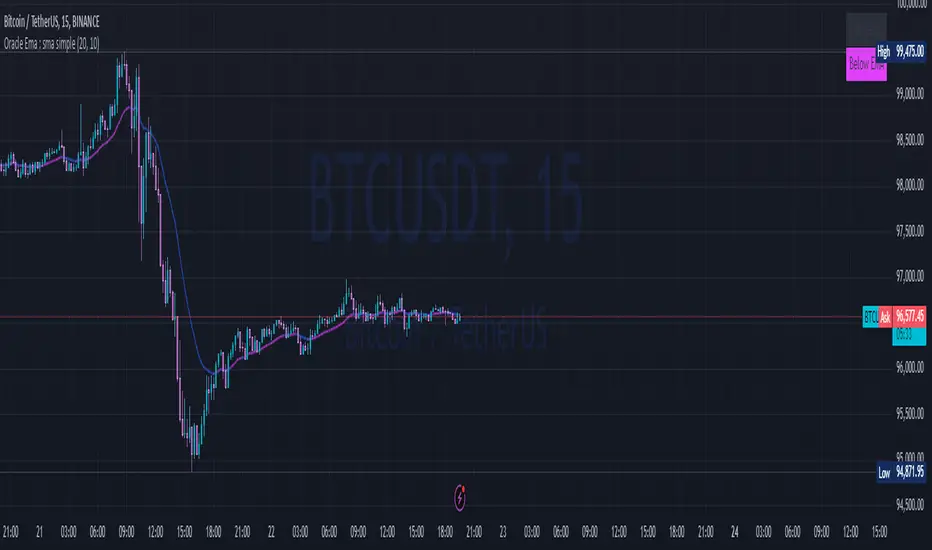
The Gradient Moving Average with Table is a visual-enhanced moving average indicator that dynamically changes its color based on price movements. It provides a smooth gradient effect on the moving average line and includes a table that indicates whether the price is above or below the MA, using turquoise and pink colors for clear visibility.
🔹 Key Features
✅ Dynamic Gradient Effect on EMA/SMA
The moving average line gradually changes color based on price movement.
Fuchsia (pink) when the MA is decreasing.
Blue when the MA is increasing.
✅ Price Position Table (Top-Right Corner)
Displays whether the price is above (turquoise) or below (pink/fuchsia) the moving average.
Adapts automatically based on EMA or SMA selection.
✅ Customizable Inputs
Choose EMA or SMA as the base moving average.
Adjust gradient intensity to control color transparency.
Toggle the table display ON/OFF.
📊 How It Works
1️⃣ The script calculates a moving average (SMA or EMA).
2️⃣ It determines price movement (uptrend or downtrend) based on price difference.
3️⃣ A gradient color effect is applied dynamically:
The more volatile the movement, the stronger the gradient effect.
Less transparency for strong trends, more transparency for stable zones.
4️⃣ A real-time table shows whether the price is above or below the MA, with colors:
Turquoise (Above)
Pink/Fuchsia (Below)
🛠 Customization Options
Moving Average Type: Select EMA or SMA.
Gradient Intensity: Adjust the transparency and color effect strength.
Table Display: Toggle the table ON or OFF.
🎯 Ideal For
Traders who want a clear visual representation of market trends.
Scalpers and swing traders needing quick trend recognition.
Users who prefer color-coded visual aids over complex charts.
This indicator enhances traditional moving averages with a modern gradient effect and real-time status updates for quick decision-making. 🚀
Overview
The Gradient Moving Average with Table is a visual-enhanced moving average indicator that dynamically changes its color based on price movements. It provides a smooth gradient effect on the moving average line and includes a table that indicates whether the price is above or below the MA, using turquoise and pink colors for clear visibility.
🔹 Key Features
✅ Dynamic Gradient Effect on EMA/SMA
The moving average line gradually changes color based on price movement.
Fuchsia (pink) when the MA is decreasing.
Blue when the MA is increasing.
✅ Price Position Table (Top-Right Corner)
Displays whether the price is above (turquoise) or below (pink/fuchsia) the moving average.
Adapts automatically based on EMA or SMA selection.
✅ Customizable Inputs
Choose EMA or SMA as the base moving average.
Adjust gradient intensity to control color transparency.
Toggle the table display ON/OFF.
📊 How It Works
1️⃣ The script calculates a moving average (SMA or EMA).
2️⃣ It determines price movement (uptrend or downtrend) based on price difference.
3️⃣ A gradient color effect is applied dynamically:
The more volatile the movement, the stronger the gradient effect.
Less transparency for strong trends, more transparency for stable zones.
4️⃣ A real-time table shows whether the price is above or below the MA, with colors:
Turquoise (Above)
Pink/Fuchsia (Below)
🛠 Customization Options
Moving Average Type: Select EMA or SMA.
Gradient Intensity: Adjust the transparency and color effect strength.
Table Display: Toggle the table ON or OFF.
🎯 Ideal For
Traders who want a clear visual representation of market trends.
Scalpers and swing traders needing quick trend recognition.
Users who prefer color-coded visual aids over complex charts.
This indicator enhances traditional moving averages with a modern gradient effect and real-time status updates for quick decision-making. 🚀
開源腳本
秉持TradingView一貫精神,這個腳本的創作者將其設為開源,以便交易者檢視並驗證其功能。向作者致敬!您可以免費使用此腳本,但請注意,重新發佈代碼需遵守我們的社群規範。
// (\_/)
// ( •.•)
// (")_(")
// ( •.•)
// (")_(")
免責聲明
這些資訊和出版物並非旨在提供,也不構成TradingView提供或認可的任何形式的財務、投資、交易或其他類型的建議或推薦。請閱讀使用條款以了解更多資訊。
開源腳本
秉持TradingView一貫精神,這個腳本的創作者將其設為開源,以便交易者檢視並驗證其功能。向作者致敬!您可以免費使用此腳本,但請注意,重新發佈代碼需遵守我們的社群規範。
// (\_/)
// ( •.•)
// (")_(")
// ( •.•)
// (")_(")
免責聲明
這些資訊和出版物並非旨在提供,也不構成TradingView提供或認可的任何形式的財務、投資、交易或其他類型的建議或推薦。請閱讀使用條款以了解更多資訊。